Services
Services Overview
The Services Overview page displays a status summary for all the configured connections, including the number of services currently configured, errored, or running. The sections listed below are split by service types to show the individual status counts. Clicking on the View link on the far right will navigate to the corresponding Gateway page.
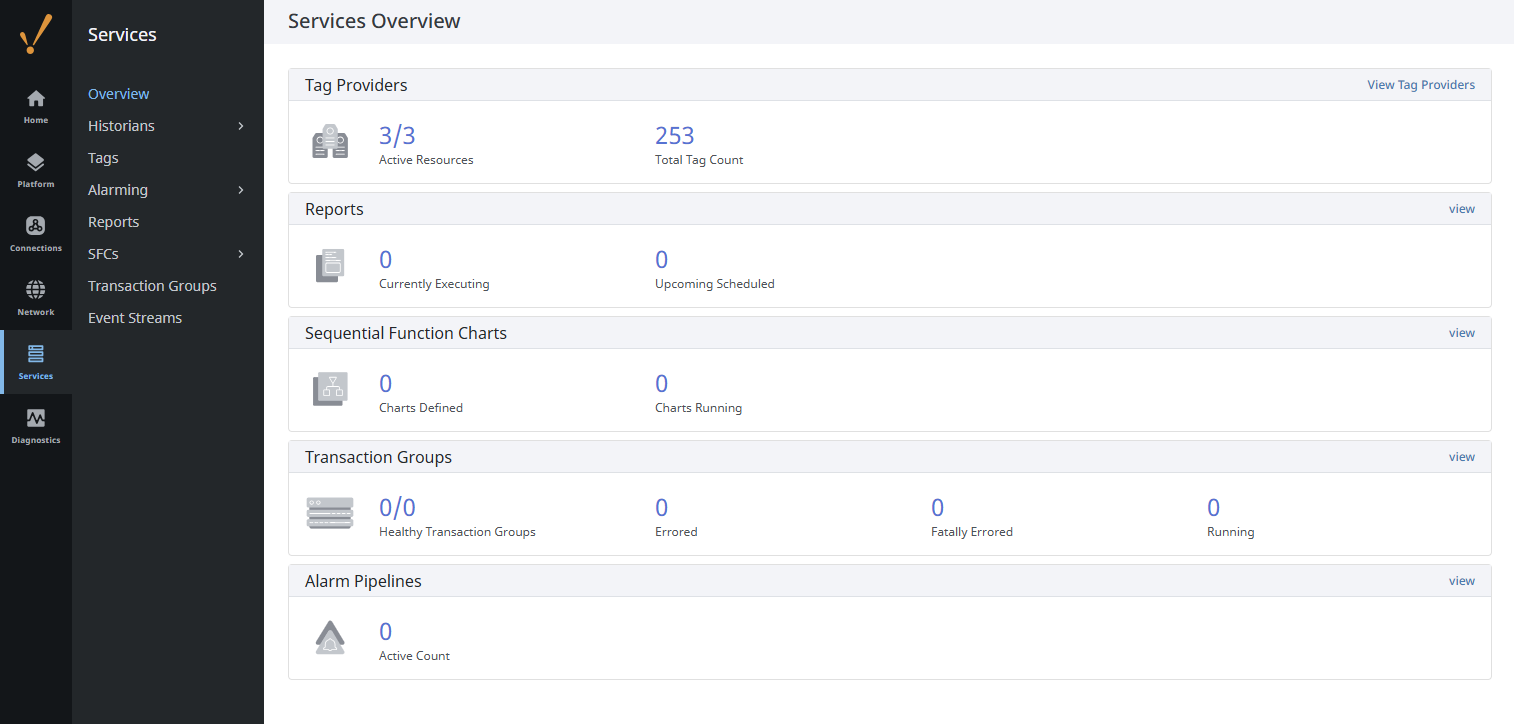
The different categories that you can configure from the Services section are as follows:
- Historians
- Tags
- Alarming (Settings, Journal, Notification, Rosters, and Schedules)
- Reports
- Sequential Function Charts (Settings and Charts)
- Transaction Groups
- Event Streams
Historians
The Historian page is located on the Gateway webpage's Services > Historians > Historians section. This section is where Historical Tag Providers are configured, or new historical providers created. Each historical provider will have both general historical settings and settings unique to each provider. Note that this is not where tag history is enabled or disabled.
The Historians page contains information about the Gateway's configured historical providers by showing a list of all historical providers.
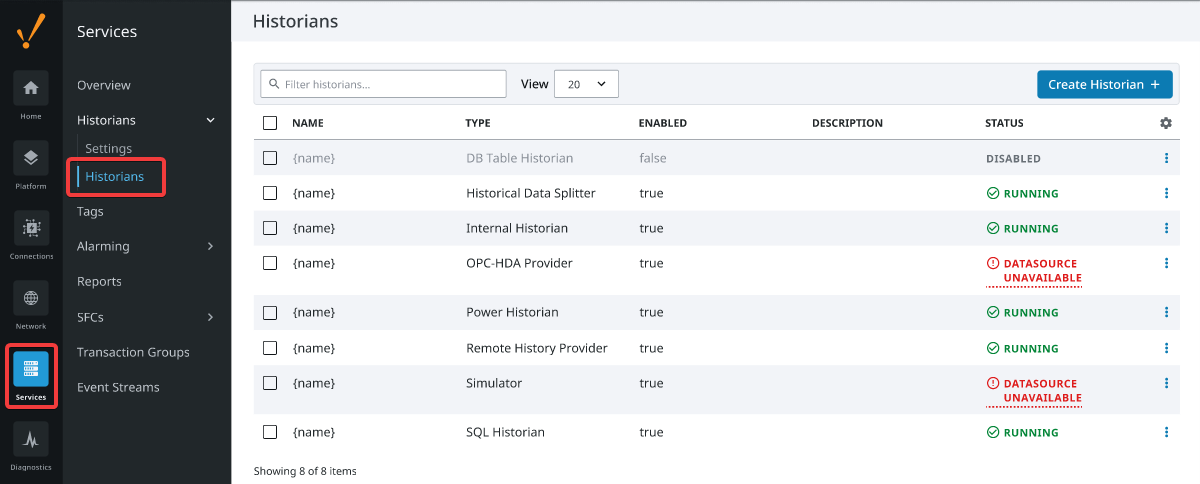
Clicking on an errored historian's state will show an error message that may help fix the problem.

There are more options within the three dots menu on the right where you can do things such as edit, rename, or duplicate historical providers. You can also view details about a specific history provider, disable the history provider itself, or delete the history provider entirely.

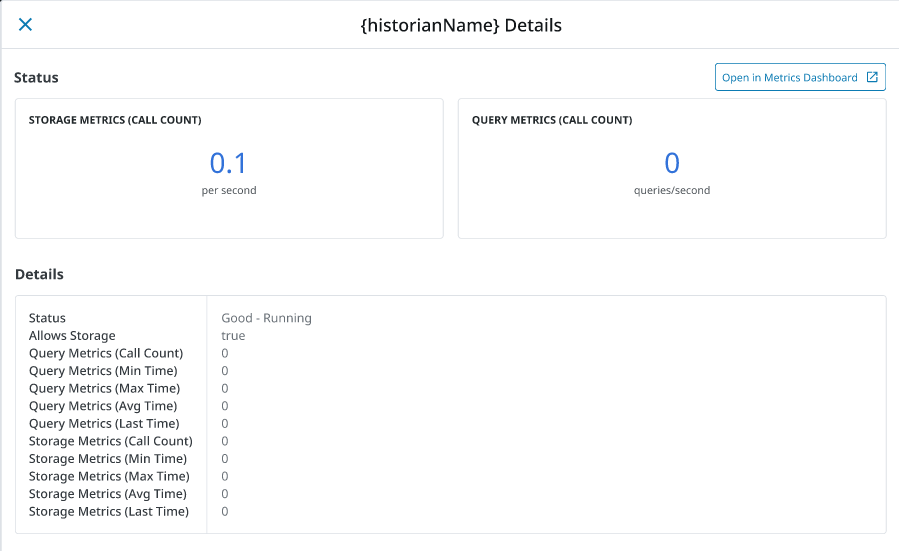
Clicking on the View Details button within the three dots menu on the right will open up a page with more information about the specified historical provider. This information includes the status of the historical provider, query metrics, and storage metrics.
Tags
The Tags page is located on the Gateway webpage's Services > Tags section. This section is where Realtime Tag Providers are configured, or new standard or remote providers are created. Note that this is not where individual tags are set up.
The Tags page contains information about the Gateway's configured tags and Realtime Tag Providers by listing all of the Realtime Tag Providers and displaying any issues.
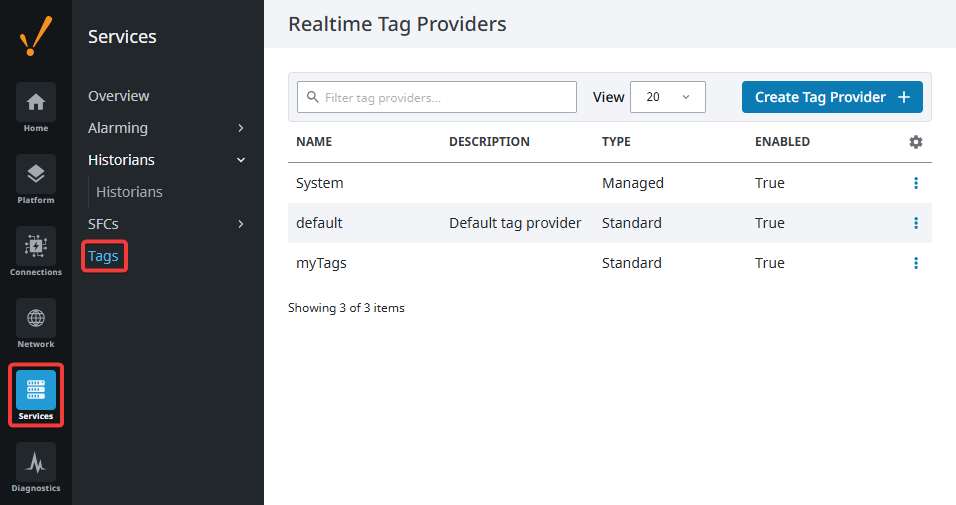
Clicking on an errored provider's state will show an error message that may help fix the problem.

There are also options within the three dots menu on the right that allow you to do things such as edit, rename, or duplicate non-default Realtime Tag Providers. Furthermore, you can view which Tag Groups your Realtime Tag Provider is a part of, as well as browse individual tags within the provider, disable the provider itself, or delete the provider completely.

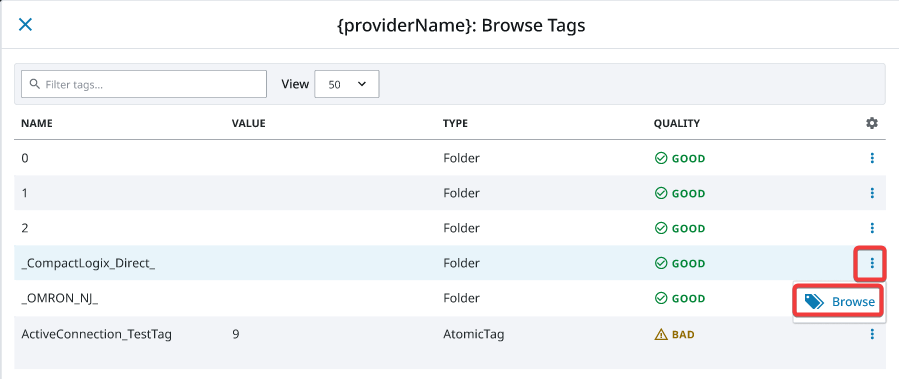
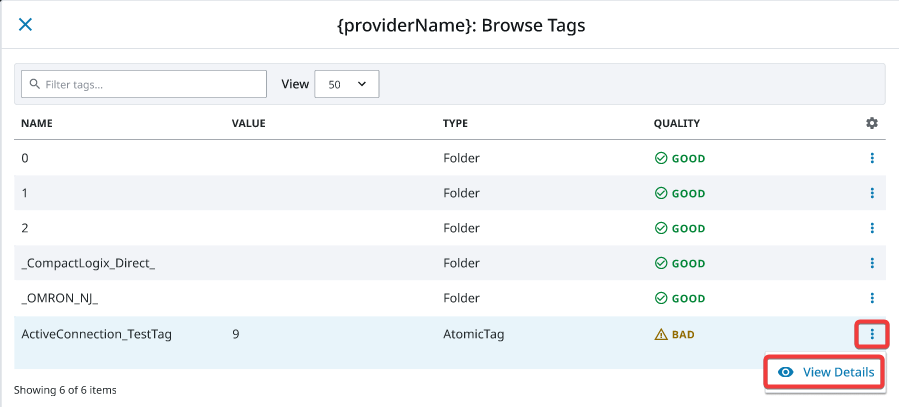
Browsing through the Tag Provider will display a list of all currently configured tags in that Tag Provider, and show some basic information about them. You can also browse through the tag structure to get more information about each tag.
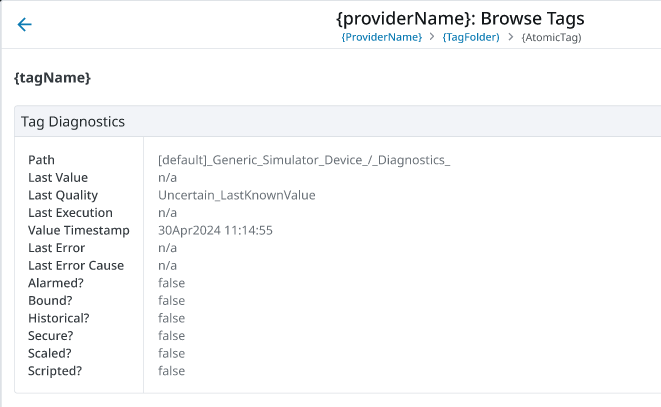
When clicking the View Details button for an individual tag within the three dots menu, you will be brought to a Tag Diagnostics screen that will provide more detailed information about that particular tag, such as the tag path and what its last value was, among other information.
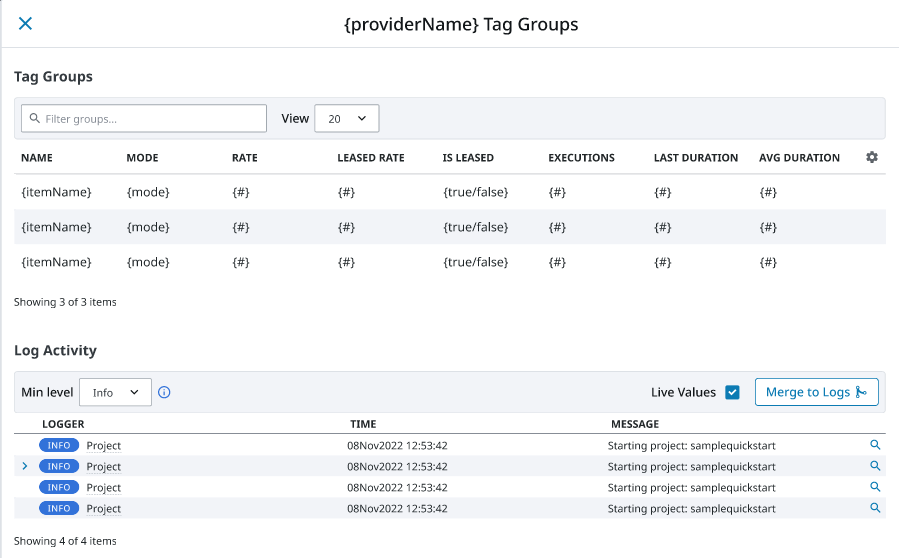
The View Tag Groups button, accessed within the Tag Provider's three dots menu, allows you to see the configured Tag Groups. This panel shows data like the number of executions for each Tag Group, the duration of last time the Group was executed, and the average duration in milliseconds. The Log Activity section displays any log events that relate to that particular provider.
Alarming
The Alarming section provides general alarm configuration settings to provide up-to-date status of alarms, store alarm history, build the logic for how, why, and when alarm notifications are delivered, manage alarm notifications for user groups, and send Email, SMS, or Voice notifications. With all these features and functions in Alarming, you can easily create alarms, and design and manage your alarm notifications any way you choose.
| Page | Description |
|---|---|
| Settings | This General setting provides of some basic alarm configuration settings. |
| Pipelines | The Alarm Pipelines page lists the currently configured alarm pipelines in the Gateway. Each pipeline displays the number of alarm items currently running through it. Click on the three dot menu icon on the right to open up the View Details panel that will show the alarm pipeline status and logs. The tabs at the top of the panel will switch between the Pipeline Status and the Pipeline Logs. This log viewer will act as a miniature log viewer that will only show logs pertaining to this particular pipeline. |
| Journal | Alarm Journals are configured in the Alarming section to store basic historical information in a database about alarms that occurred, such as their source and timestamp, associated data on the alarm, and the values of the alarm's properties at the time the event occurred. |
| Notification | Notification Profiles are configured in the Alarming section to allow for Email, SMS, or Voice notifications to be sent out when an alarm event occurs. |
| Rosters | The On-Call Roster is where you create user groups to be notified when an alarm occurs. When an alarm is triggered, it is sent to a designated On-Call Roster where it evaluates the users schedules, and only notifies those users that have an active schedule. Users that are off-schedule will not be notified. |
| Scheduling | The Scheduling page allows you to create recurring alarms based off a specified schedule. Holidays, weekends, and other time-related factors can be set as part of a schedule. |
Reports
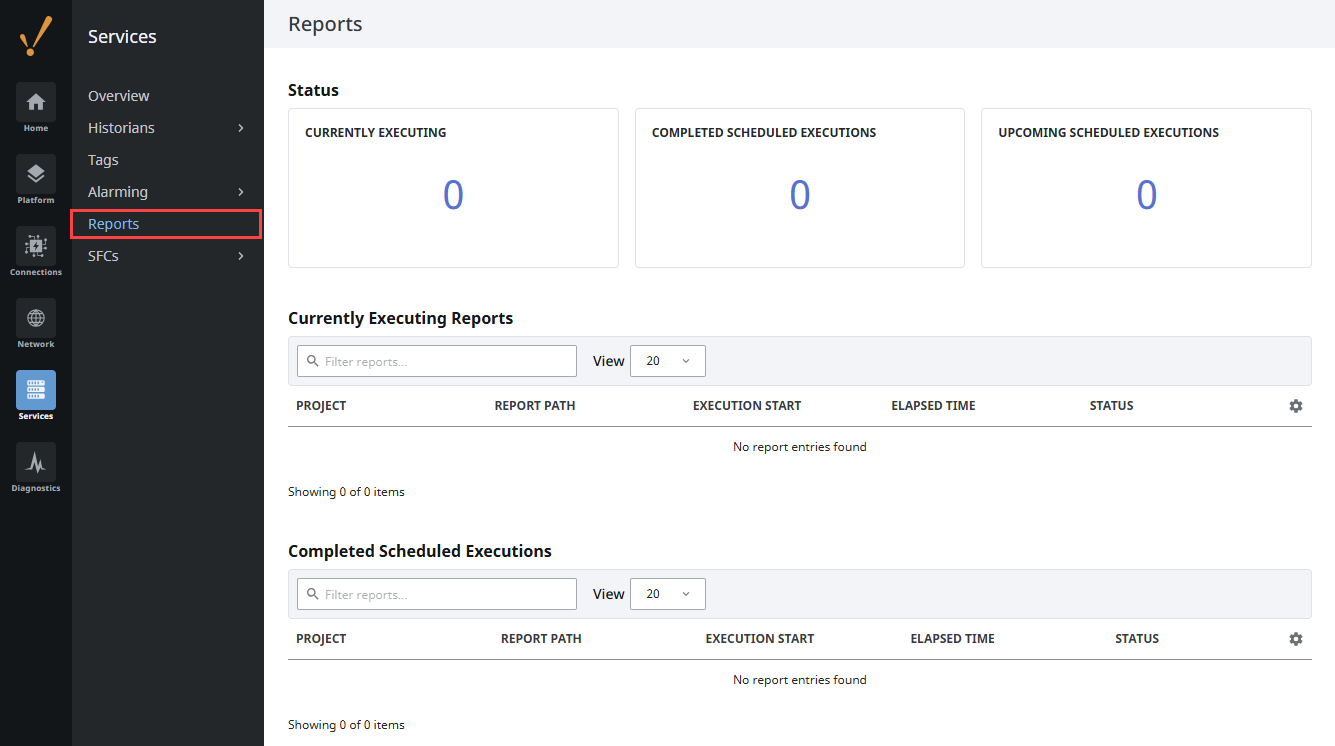
The Reports page shows information on any Reports that have at least one scheduled action set up. The top of the page displays the number of reports that have current, completed, or upcoming executions. The sections below list the report details within those states, such as the report project or last execution time. The final two sections at the bottom of the page are a Published Reports list with the project, report name, and report path, and the Log Activity that displays all event messages related to reports.
Sequential Function Charts
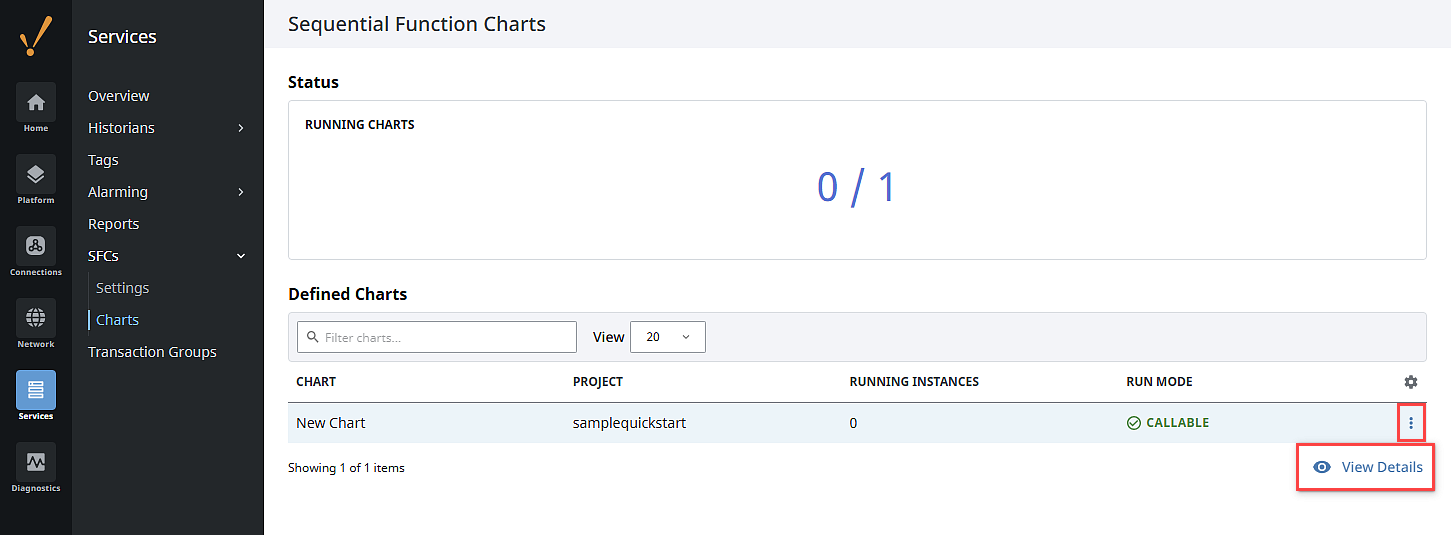
A Sequential Function Chart (SFC) is a series of scripts that are defined in a single location and then called in sequential order. The Sequential Function Charts section includes both a Sequential Function Chart Settings and Sequential Function Charts page. Select Services > SFCs > Settings to configure the SFC Settings.
The Sequential Function Charts page displays current SFCs and running chart stats. Each chart also has a Details panel that displays more information about the particular chart, including log activity. Expand the three dots menu and select View Details to access this panel.
Transaction Groups
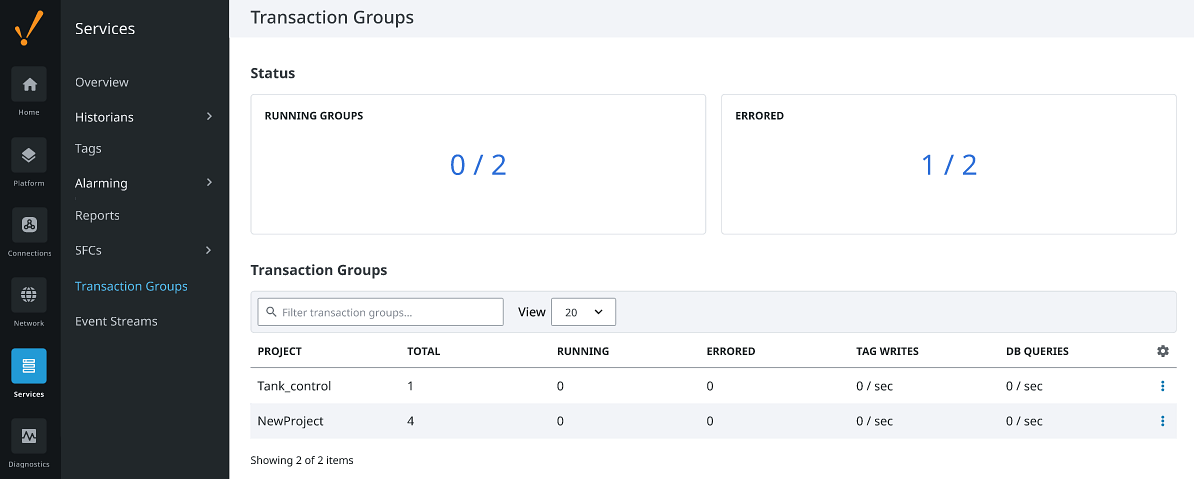
The Transaction Groups page makes it easy to get a quick count of the currently running Transaction Groups, as well as the currently errored groups. Below the counts is a list of projects that contain Transaction Groups and some basic information like how many are running, amount of tag writes, and the amount of generated database queries. Clicking the three dots menu icon to the right of each project listing opens more information, including the group, tag throughput, and database counts, as well as group path lists sorted by Running, Non-Running, and Longest Running.
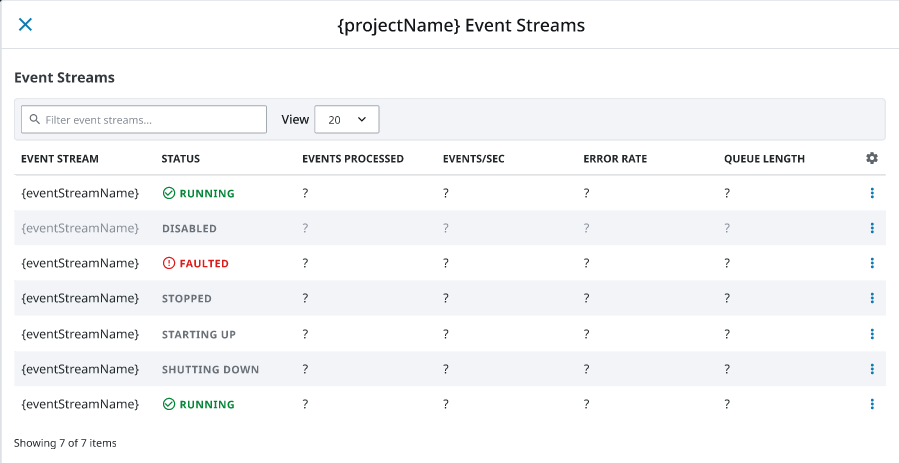
Event Streams
The Event Streams page gives an overview of all the event streams within each project on the Gateway. Several metrics are displayed in the Status section at the top, including the number of currently running streams, the number of faulted streams, and the number of disabled streams.
Below the Status section is a table containing a list of projects in the Gateway. The table displays the number of event streams each project has, as well as an aggregate of the number of events per second, and the number of faulted streams within each project.
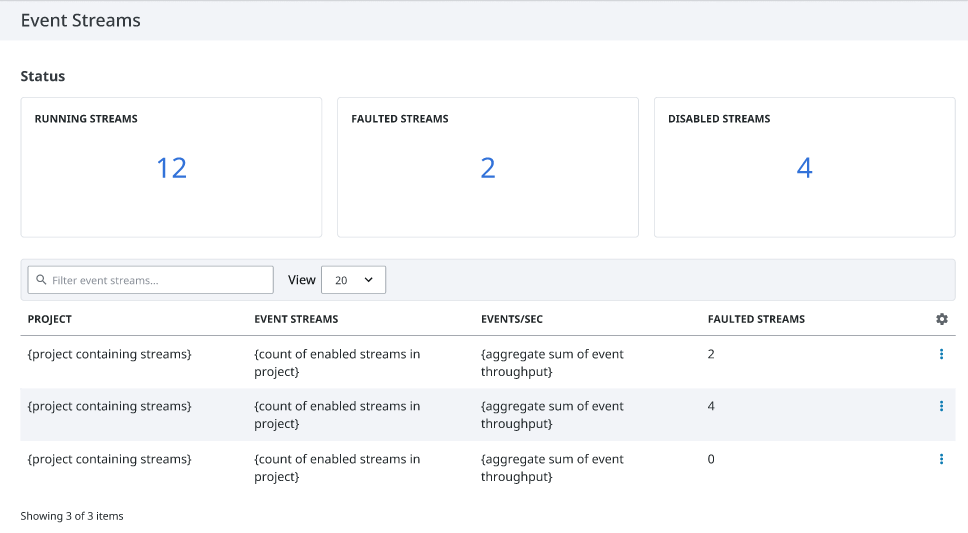
Clicking on the three dots menu on the right will give an additional View Details option. This page displays more in-depth information about the event streams inside the specified project, and shows metrics such as the event stream's status, the number of events processed, the number of events per second, and more.