Logs
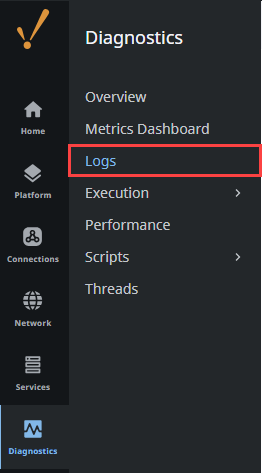
One of the most important troubleshooting tools of the Gateway Webpage is the Logs page. This console shows errors caused by Gateway events like database or device connections, authentication profiles, Alarm Journals and pipelines, and anything else that is Gateway-scoped. You can find logs on the Gateway Webpage under Diagnostics > Logs.
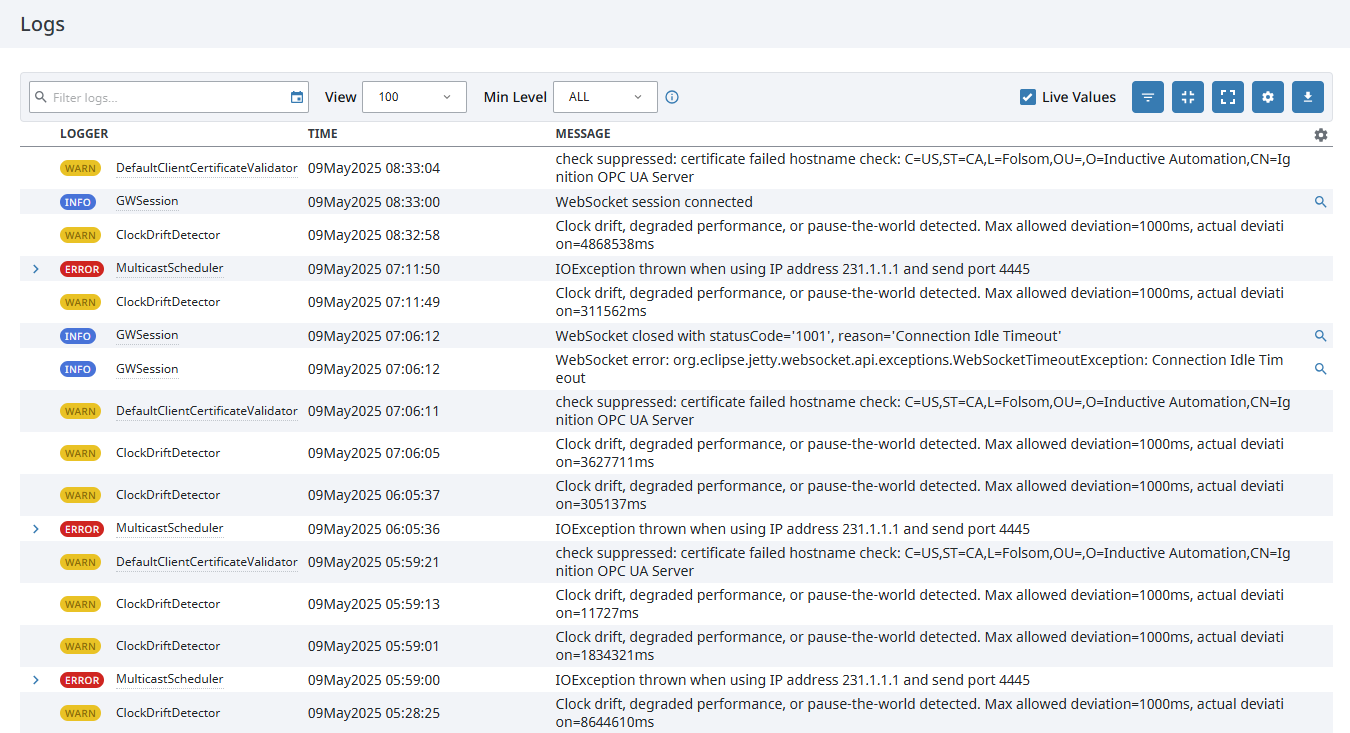
The Gateway Logs also provide a wealth of information about the running state of the Gateway by allowing you to see a live flow of log events in the system.
| Attribute | Description |
|---|---|
| Logger | Name of the logger that describes the context of the message. |
| Time | Time of log. |
| Message | Message for the log. |
| Filter | Search criteria to filter for specific tasks or events. Click the Calendar |
| Min Level | Dropdown menu with options: All, Trace, Debug, Info, Warn and Error. |
| Live Values | Toggle switch to turn live values on or off. |
Changing Logging Levels
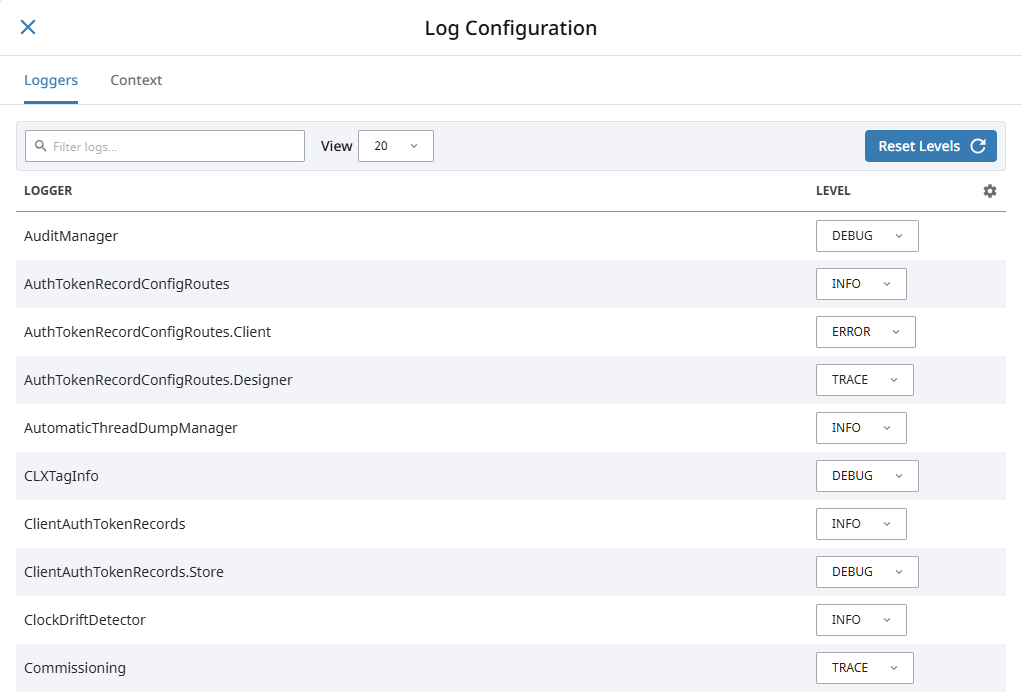
The logs can be filtered by using a search term or by date. For example, you could select the DEBUG or TRACE logging levels, which will cause that specific logger to report more detailed logs, allowing you to better diagnose an issue. Note that if you set a parent logger to a specific level, it will also set all children of that logger to the same level. To change logging levels:
- Go to the Gateway's Diagnostics > Logs page and click on the Settings
 icon.
icon. - Search for the logger name in the Filter box on the Log Configuration popup.
- Select the desired logging level from the dropdown to the right of the logger name.
Downloading the Logs
Gateway logs can also be exported using the Download Logs ![]() icon on the far right of the page.
icon on the far right of the page.
Printing to the Logs
You can print to Gateway logs by using the system.util.getLogger() function.
logger = system.util.getLogger("My Logger Name")
logger.warn("My Warning Message")
Mapped Diagnostics Context Keys
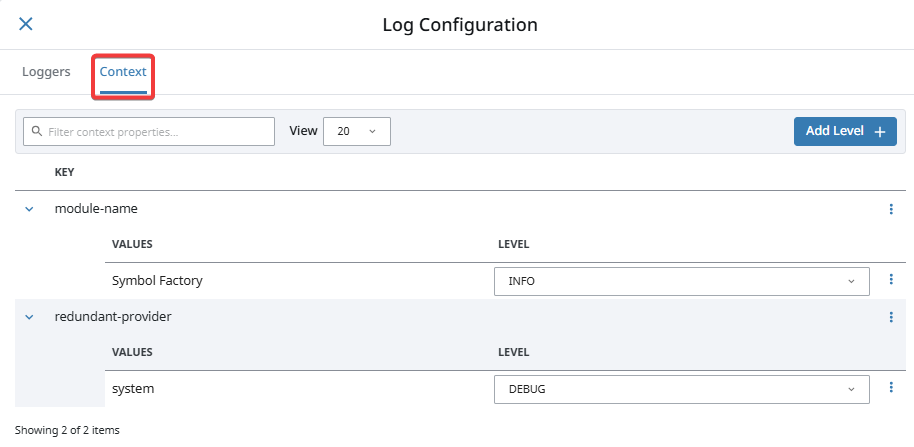
Mapped Diagnostic Context (MDC) Keys allow you to quickly set logging levels for all loggers that are related to a specific part of your Gateway. So instead of setting individual loggers to DEBUG, you can use MDC Keys to set a group of loggers to DEBUG all at once.
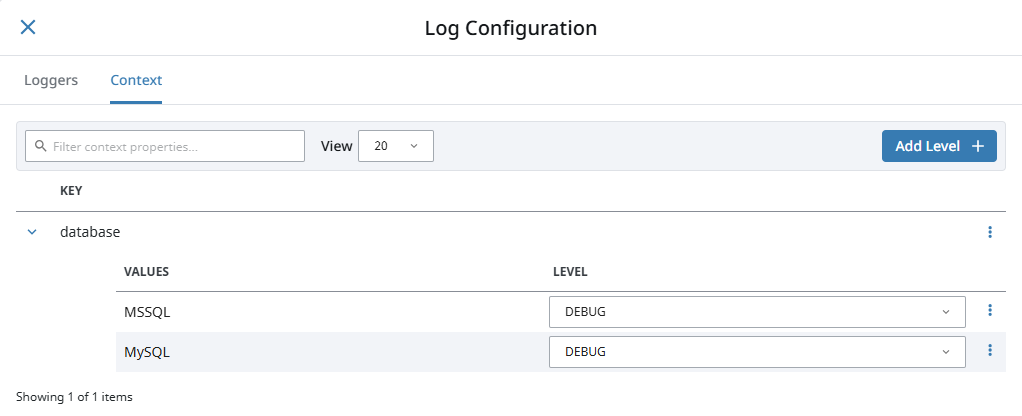
To use MDC Keys, click the Settings ![]() icon on the Logs page and navigate to the Context tab. This is where all existing MDC Keys will be displayed, and where new ones can be added by specifying Key-Value pairs that match a particular system.
icon on the Logs page and navigate to the Context tab. This is where all existing MDC Keys will be displayed, and where new ones can be added by specifying Key-Value pairs that match a particular system.
To add an MDC Key:
-
Click on Add Level +.
-
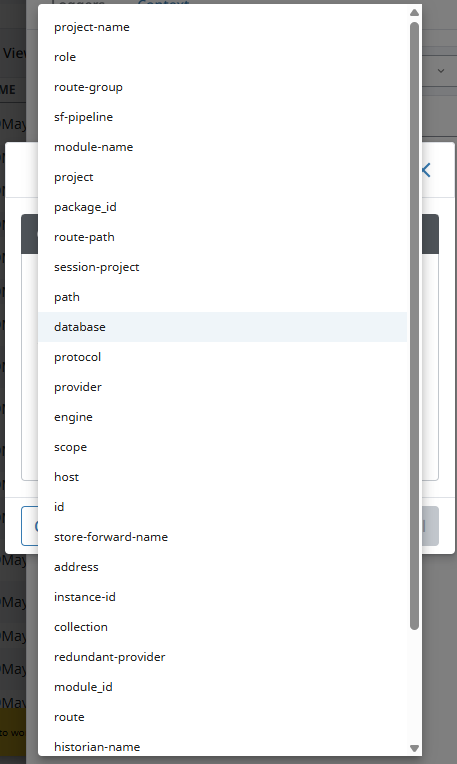
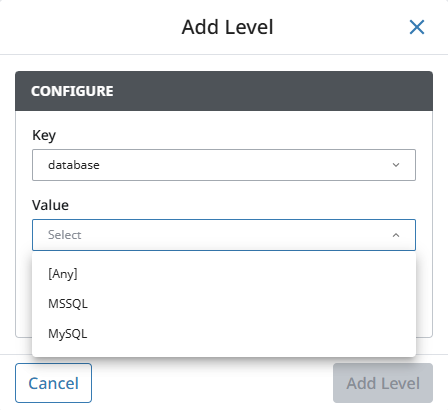
Select the Key field and pick a Key from the available list of Keys for your system.
-
Select the Value field and choose from the list of values that relate to the selected Key.
-
Set the appropriate logging level in the Set Level field, typically either DEBUG or TRACE.
-
Click Add Level.

You can add as many Keys-Value pairs as you would like, even with the same Key. This allows you to quickly set the appropriate loggers to find out more information about the system you are trying to troubleshoot. In our example, we first added our database called MSSQL. Then, using the database Key again, we can add in the database called MySQL.
Filter by Mapped Diagnostics Context Key
The Logs can also be filtered to show only logs that pertain to an MDC Key. This can be useful when altering the logging level of one or more MDC Keys.
To set an MDC filter on the logs, simply click the Add Mapped Diagnostic Context Filter ![]() icon on the Logs page to open a window where MDC Key filters can be set. The filter can be specified for all values in a Key by not specifying a Value.
icon on the Logs page to open a window where MDC Key filters can be set. The filter can be specified for all values in a Key by not specifying a Value.

Merging to Logs
Some of the other pages, such as the Gateway Scripts page, also contain a logger that will just show logs that are relevant for that particular section. These log views all contain a button on the right side called Merge to Logs. This button allows the current filter to be applied to the main logs page, allowing you to still see only the logs for that section but use all of the tools available.
![]()