Metrics Dashboard
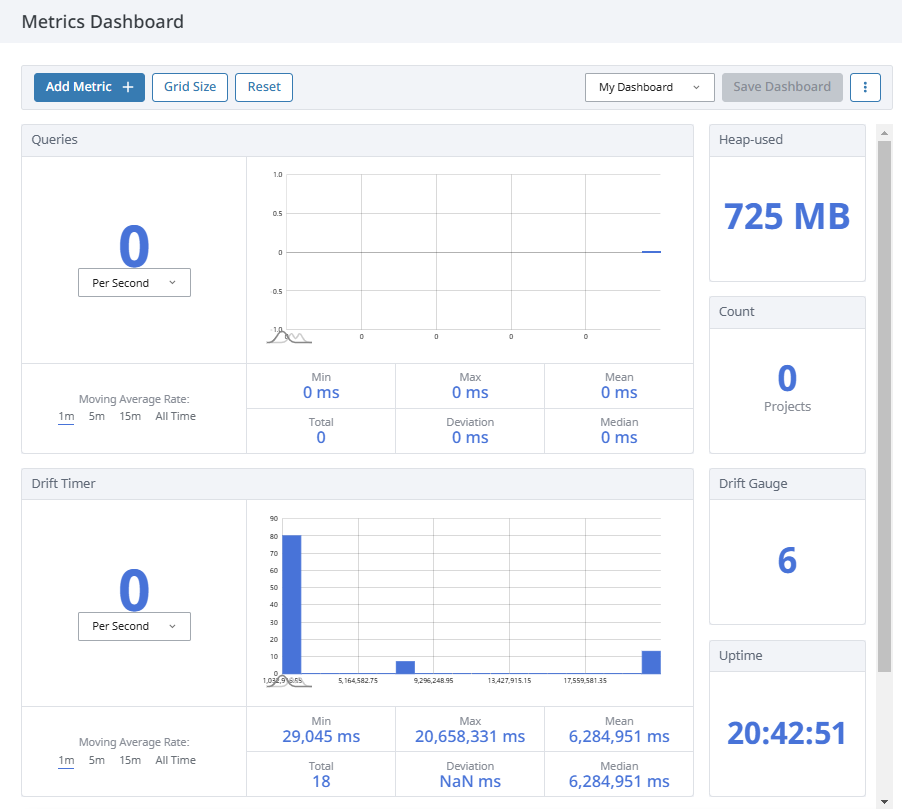
The Metrics Dashboard allows users to visualize a variety of metrics on their own customizable dashboards. Users may browse and search for any registered metric and add it to a dashboard, expanding the diagnostic capabilities available in the Diagnostics section.
Some Gateway pages will have an Open Metrics Dashboard option. Clicking on it will take you to a predefined set of metrics related to the Gateway resource page. These metrics are not saved, but you can save them as a new dashboard.
User Interface
![]()
The table below describes the Metric Dashboard page's user interface.
| Attribute | Description |
|---|---|
| Add Metric | Select from a list of available metrics to drag and drop onto the dashboard grid. |
| Grid Size | Control the number of rows and columns on the grid. |
| Reset | Clear all metrics tiles from the current dashboard. |
| Dashboard Dropdown | Switch between saved dashboards. |
| Save Dashboard | Save the current dashboard as an option. changes, rename a saved dashboard, or delete the current dashboard. |
| Three Dots Menu | Allows users to rename the dashboard, save the current dashboard as new, clear the current dashboard, or delete the current dashboard. |
You can create multiple dashboards by using the Save as New option in the three dots menu. To switch between them, use the Dashboard Dropdown on the top right of the page.
Types of Metrics
Gauge
Gauges can be any kind of instant-read measurement, such as the number of megabytes of memory consumed, the count of faulted database connections, or the length of a pending task queue. Gauges are used to display a dynamic number.

| Property | Description |
|---|---|
| value | A numeric value. |
X/Y
An X/Y metric is a pair of gauges that can be interpreted as a ratio. This is an instant-read gauge on a value that has a maximum, such as heap size or a fixed-size thread pool.

| Property | Description |
|---|---|
| value | A numeric value. |
| max | The maximum value. |
Meter
A meter measures the rate at which something occurs, such as the number of messages sent per second. Users can select the units as well as which of the moving average rates to display.

| Property | Description |
|---|---|
| count | The number of events seen. |
| meanRate | The mean rate, overall. |
| oneMinuteRate | The one-minute moving average rate. |
| fiveMinuteRate | The five-minute moving average rate. |
| fifteenMinuteRate | The fifteen-minute moving average rate. |
Histogram
A histogram measures the statistical distribution of values in a stream of data. Hovering over a quantile reveals the value at that quantile.

| Property | Description |
|---|---|
| count | The number of values or events seen. |
| min | The minimum value (in milliseconds). |
| max | The maximum value (in milliseconds). |
| mean | The mean value (in milliseconds). |
| stdDev | The standard deviation (in milliseconds). |
| median | The median value (in milliseconds). |
Timer
A timer is used to understand both the frequency of and duration of events. It is a combination of a meter (rate of occurrence) and a histogram (distribution of duration). A timer combines the functions and properties of both a meter and a histogram.
Available Metrics
All metrics currently available are described below. When adding a metric, the described metric types will be available in the Add Metric popup. Use the dropdowns to expand all metric options.
authTokenRecords
There are authTokenRecords for both the Client and Designer.
changeEventDistributionOperationAccumulator
| Metric | Description | Size | Type |
|---|---|---|---|
| batchProcessDuration | The amount of time that the ChangeEventDistributionOperationAccumulator takes to process a batch. | 4x2 | Timer |
| changeEventDistributions |
| --- | --- |
| changeEventListenersMutations |
| --- | --- |
changeEventListeners.count
The number of ChangeEvent Listeners registered with the system.
- Size: 1x1
- Type: Gauge
changeEventPersistenceOperationAccumulator
| Metric | Description | Size | Type |
|---|---|---|---|
| batchProcessDuration | The amount of time that the ChangeEventPersistenceOperationAccumulator takes to process a batch. | 4x2 | Timer |
| batchSize | The number of ChangeEvent Contexts in the ChangeEventPersistenceOperationAccumulator batch. | 1x1 | Gauge |
| dispatchedThroughput | The throughput of ChangeEvent Contexts dispatched to the Execution task for batch processing. | 2x2 | Meter |
| queuedThroughput | The throughput of ChangeEvent Contexts added to the batch. | 2x2 | Meter |
| synchronizerDuration | The amount of time that the File Synchronizer takes to synchronize files with memory. | 4x2 | Timer |
maintenance
| Metric | Description | Size | Type |
|---|---|---|---|
| cleaner.duration | The amount of time that the Cleaner takes. | 2x4 | Timer |
| pruner.duration | The amount of time that the Pruner takes. | 2x4 | Timer |
| reaper.duration | The amount of time that the Reaper takes. | 2x4 | Timer |
records.count
The number of AuthTokenRecords in the system.
- Size: 1x1
- Type: Gauge
touchEventAccumulator
Using the metrics below, you can identify that a system is processing the incoming volume of touch events efficiently if the dispatchedThroughput keeps up with the queuedThroughput minus the collisionThroughput.
| Metric | Description | Size | Type |
|---|---|---|---|
| batchProcessDuration | The amount of time that the TouchEventAccumulator takes to process a batch. | 4x2 | Timer |
| batchSize | The number of touch events in the TouchEventAccumulator batch. | 1x1 | Gauge |
| collisionThroughput | The throughput of touch events added to the batch resulting in a collision. | 2x2 | Meter |
| dispatchedThroughput | The throughput of touch events dispatched to the Execution task for batch processing. | 2x2 | Meter |
| queuedThroughput | The throughput of touch events added to the batch. | 2x2 | Meter |
ClockDriftDetector
| Metric | Description | Size | Type |
|---|---|---|---|
| driftGauge | The most recent clock drift, in milliseconds. | 1x1 | Gauge |
| driftTimer | A timer that tracks the distribution of the duration of clock drifts. | 4x2 | Timer |
configuration
| Metric | Description | Size | Type |
|---|---|---|---|
| disk-scan | The number of scans to a resource's config.json file for configuration changes to resources. | 4x2 | Timer |
| notification-handlers | The number of notifications for a resource's configuration changes. | 4x2 | Timer |
| notification-queue | The current number of queued changes to a resource's configuration. | 1x1 | Gauge |
| push | The number of writes or changes to a resource's configuration. | 4x2 | Timer |
databases
| Metric | Description | Size | Type |
|---|---|---|---|
connection-{dbName} | Each connected database will have the following associated metrics:
| --- | --- |
| queries | Measures the rate and distribution of query execution on all database connections. | 4x2 | Timer |
eventStream
Metrics for event streams will only appear if an event stream is configured. Each event stream stage will have their own set of metrics from the table below.
| Metric | Description | Size | Type |
|---|---|---|---|
| errors | The number of errors that have occurred in the parent stage. | 1x1 | Meter |
| processTimeNs | The average amount of time it takes the parent stage to process an event. | 4x2 | Timer |
| received | The average number of events per unit of time received by the parent stage. | 2x2 | Meter |
| queue.eventCount | The number of events currently waiting to be processed by the parent stage. | 1x1 | Gauge |
| forwarded | The number of events that passed through the filter stage. | 1x1 | Meter |
gateway-network
| Metric | Description | Size | Type |
|---|---|---|---|
| activeMsgCountAll | Total count of all active messages currently being sent over the Gateway Network. | 1x1 | Gauge |
| IncomingBytesSecAll | Accumulation of the number of bytes received per second across all Gateways. | 1x1 | Gauge |
| IncomingMsgsPerSecAll | Accumulation of messages received per second across all Gateways. | 1x1 | Gauge |
| nonProtobufSerializedMsgs | The number of Java serializations performed on messages sent over a connection to an 8.1 remote Gateway. | 1x1 | Gauge |
| OutgoingBytesSecAll | Accumulation of the number of bytes sent per second to all Gateways. | 1x1 | Gauge |
| OutgoingMsgsPerSecAll | Accumulation of messages sent per second to all Gateways. | 1x1 | Gauge |
| pendingAcksExpired | Indicates how many pending acknowledgements were purged during the last cleanup execution. This metric is relevant for outgoing connections. Note: Some messages create a pending acknowledgement object. When the message is uploaded to another Gateway and that Gateway acknowledges receiving the message, the pending acknowledgement object is cleared. If no acknowledgement is received, these objects can become orphaned. Orphaned pending message acknowledgements are regularly purged. | 1x1 | Gauge |
| pendingMessagesExpired | Records how many messages were purged during the last cleanup execution, giving an estimate of potentially lost messages. This metric is relevant for incoming connections. Messages that were dispatched, but not downloaded by the other Gateway are regularly purged. | 1x1 | Gauge |
| PendingMsgCountAll | Total count of all messages waiting to be sent over the Gateway Network. | 1x1 | Gauge |
| proxyMsgsPerSec | The number of messages per second that are forwarded through this Gateway. Only applies when this Gateway is configured as a proxy Gateway. | 2x2 | Meter |
| services | incomingServiceCalls
| --- | --- |
historian
The following metrics will be available for any of Ignition's historian systems once a historian has been created.
{historian}.storage
| Metric | Description | Size | Type |
|---|---|---|---|
| storage | The number of storage calls happening per unit of time. This is different than the throughput as each call can contain batches of records, as opposed to individual records. | 4x2 | Timer |
| throughput.projected | The projected or theoretical number of records stored to the historian per unit of time. This metric is based off what is currently happening in the Gateway. | 2x2 | Meter |
| throughput.actual |
| --- | --- |
{historian}.query
| Metric | Description | Size | Type |
|---|---|---|---|
| query | The number of query calls happening per unit of time. This is different than the throughput as each call can contain batches of records, as opposed to individual records. | 4x2 | Timer |
| throughput.projected | The projected or theoretical number of records queried from the historian per unit of time. This metric is based off what is currently happening in the Gateway. | 2x2 | Meter |
| throughput.actual | The actual number of records queried from the historian per unit of time. | 2x2 | Meter |
ignition
| Metric | Description | Size | Type |
|---|---|---|---|
| designer.requests | Measures the rate and distribution of designer requests. | 4x2 | Timer |
| performance |
| --- | --- |
| uptime | Total uptime. | 1x1 | Gauge |
perspective
| Metric | Description | Size | Type |
|---|---|---|---|
| bindings | Perspective binding count. | 1x1 | Gauge |
| components | Perspective components count. | 1x1 | Gauge |
| expressions | Measures the rate and distribution of expressions. | 4x2 | Timer |
| fetches | Measures the rate and distribution of fetches. | 4x2 | Timer |
| pages | Perspective pages count. | 1x1 | Gauge |
| property-changes | Measures the rate of property changes. | 2x2 | Meter |
| scripts | Measures the rate and distribution of script executions | 4x2 | Timer |
session-{sessionName} | Each connected Perspective session will have the following associated metrics:
| --- | --- |
| sessions | Count of active sessions. | 1x1 | Gauge |
| views | Count of views. | 1x1 | Gauge |
projects
| Metric | Description | Size | Type |
|---|---|---|---|
| (projectName).resources | Count of resources per project. | 1x1 | Gauge |
| count | Count of projects. | 1x1 | Gauge |
| disk-scan | Measures the frequency and duration of projects directory synchronization. | 4x2 | Timer |
| notification-handlers | The number of notifications from updates for the project system. | 4x2 | Timer |
| notification-queue | The current number of queued changes to the project system. | 1x1 | Gauge |
| saves | Measures the rate and distribution of project saves. | 4x2 | Timer |
redundancy
Each of the following redundancy sections are within the redundancy.runtime-updates tree.
config
| Metric | Description | Size | Type |
|---|---|---|---|
| pendingUpdates | The number of master Gateway configuration changes that is yet to be synced to the backup Gateway. This value is typically zero, unless the sync process is falling behind, or the backup Gateway is no longer connected. | 1x1 | Gauge |
| dispatchedUpdatesPerSec | The rate at which master Gateway configuration changes are synced to the backup Gateway. | 2x2 | Meter |
| queuedUpdatesPerSec | The rate at which master Gateway configuration changes are queued and intended to be dispatched to the backup Gateway. | 2x2 | Meter |
alarming
| Metric | Description | Size | Type |
|---|---|---|---|
| alarmShelf |
| --- | --- |
| alarmEvents |
| --- | --- |
client-auth-token-runtime-provider
Authentication tokens are used by both Vision Clients using an Identity Provider and Perspective Offline Mode.
| Metric | Description | Size | Type |
|---|---|---|---|
| pendingUpdates | The number of client authentication tokens that is yet to be synced to the backup Gateway. This value is typically zero, unless the sync process is falling behind, or the backup Gateway is no longer connected. | 1x1 | Gauge |
| dispatchedUpdatesPerSec | The rate at which client authentication tokens are synced to the backup Gateway. | 2x2 | Meter |
| queuedUpdatesPerSec | The rate at which client authentication tokens are queued and intended to be dispatched to the backup Gateway. | 2x2 | Meter |
alarm-notification
| Metric | Description | Size | Type |
|---|---|---|---|
| pendingUpdates | The number of alarm notification pipelines and their states that is yet to be synced to the backup Gateway. This value is typically zero, unless the sync process is falling behind, or the backup Gateway is no longer connected. | 1x1 | Gauge |
| dispatchedUpdatesPerSec | The rate at which alarm notification pipelines and their states are synced to the backup Gateway. | 2x2 | Meter |
| queuedUpdatesPerSec | The rate at which alarm notification pipelines and their states are queued and intended to be dispatched to the backup Gateway. | 2x2 | Meter |
projects
| Metric | Description | Size | Type |
|---|---|---|---|
| pendingUpdates | The number of project updates and project configuration changes that is yet to be synced to the backup Gateway. This value is typically zero, unless the sync process is falling behind, or the backup Gateway is no longer connected. | 1x1 | Gauge |
| dispatchedUpdatesPerSec | The rate at which project updates and project configuration changes are synced to the backup Gateway. | 2x2 | Meter |
| queuedUpdatesPerSec | The rate at which project updates and project configuration changes are queued and intended to be dispatched to the backup Gateway. | 2x2 | Meter |
sfc
| Metric | Description | Size | Type |
|---|---|---|---|
| pendingUpdates | The number of sequential function charts and their states that is yet to be synced to the backup Gateway. This value is typically zero, unless the sync process is falling behind, or the backup Gateway is no longer connected. | 1x1 | Gauge |
| dispatchedUpdatesPerSec | The rate at which sequential function charts and their states are synced to the backup Gateway. | 2x2 | Meter |
| queuedUpdatesPerSec | The rate at which sequential function charts and their states are queued and intended to be dispatched to the backup Gateway. | 2x2 | Meter |
schedules
| Metric | Description | Size | Type |
|---|---|---|---|
| Always.active | A boolean represented by 0 or 1 for if the Always alarm schedule is active. A value of 1 means the schedule is active. | 1x1 | Gauge |
| Example.active | A boolean represented by 0 or 1 for if the Example alarm schedule is active. A value of 1 means the schedule is active. | 1x1 | Gauge |
scripts
| Metric | Description | Size | Type |
|---|---|---|---|
| gateway |
| --- | --- |
| project-(projectName) |
| --- | --- |
storeforward
| Metric | Description | Size | Type |
|---|---|---|---|
| quarantined | The current number of engines containing quarantined data. | 1x1 | Gauge |
Each configured database connection will have its own set of metrics from the table below.
| Metric | Description | Size | Type |
|---|---|---|---|
| dropped-throughput | The rate at which datapoints have been dropped by the specified engine. | 2x2 | Meter |
| forward-throughput | The rate at which datapoints are forwarded to the targeted database or Gateway. | 2x2 | Meter |
| store-throughput | The rate at which datapoints are stored to the engine. | 2x2 | Meter |
storeforward Data Type Metrics
There will be additional metrics for each connection if the database is being used to store historical data, depending on the type of data being stored. The metrics in the table below are used when storing historical data, regardless of what type of data is being stored. The following types of historical data can be stored:
- Alarming
- Auditing
- Scripting
- SECS/GEM
- Tag history
- Transaction Group
| Metric | Description | Size | Type |
|---|---|---|---|
| forward-throughput | The rate at which datapoints are forwarded to the historian. | 2x2 | Meter |
| memory buffer.data-count | The current number of datapoints stored within the memory buffer. | 1x1 | Gauge |
| memory buffer.store-throughput | The rate at which datapoints are stored to the memory buffer. | 2x2 | Meter |
| memory buffer.take-throughput | The rate at which datapoints are forwarded from the memory buffer. | 2x2 | Meter |
| local cache.data-count | The current number of datapoints stored within the local disk cache. | 1x1 | Gauge |
| local cache.store-throughput | The rate at which datapoints are stored to the local disk cache. | 2x2 | Meter |
| local cache.take-throughput | The rate at which datapoints are forwarded from the local disk cache. | 2x2 | Meter |
{data type}sink.store-throughput | The rate at which datapoints are stored to the historian engine. | 2x2 | Meter |
The {data type} in the table above refers to the type of data being stored. Reference the data types from the bulleted list above.
tags
There are tag metrics for System Tags, the default Tag Provider, and user-created Tag Providers.
batch.storage.valuePushTime
The time it takes for Memory tag values to persist to the SQLite DB when the Value Persistence property is set to Database.
- Size: 4x2
- Type: Gauge
default.storage
| Metric | Description | Size | Type |
|---|---|---|---|
| delete | The number of tag delete operations performed in the default Tag Provider. | 2x2 | Meter |
| move | The time it takes to complete a tag move operation in the default Tag Provider. | 4x2 | Timer |
| configSave | The number of tag configuration operations that have been performed in the default Tag Provider. | 2x2 | Meter |
| batch |
| --- | --- |
System.storage
| Metric | Description | Size | Type |
|---|---|---|---|
| delete | The number of tag delete operations performed in the System Tag Provider. | 2x2 | Meter |
| move | The time it takes to complete a tag move operation in the System Tag Provider. | 4x2 | Timer |
| configSave | The number of tag configuration operations that have been performed in the System Tag Provider. | 2x2 | Meter |
| batch |
| --- | --- |
vision.requests
Measures the rate and distribution of Vision requests.
Example - Adding Metrics to a Dashboard
-
Click Add Metric.
-
Select a metric from the list and click Add.
-
Hover over the grid to position the metric.
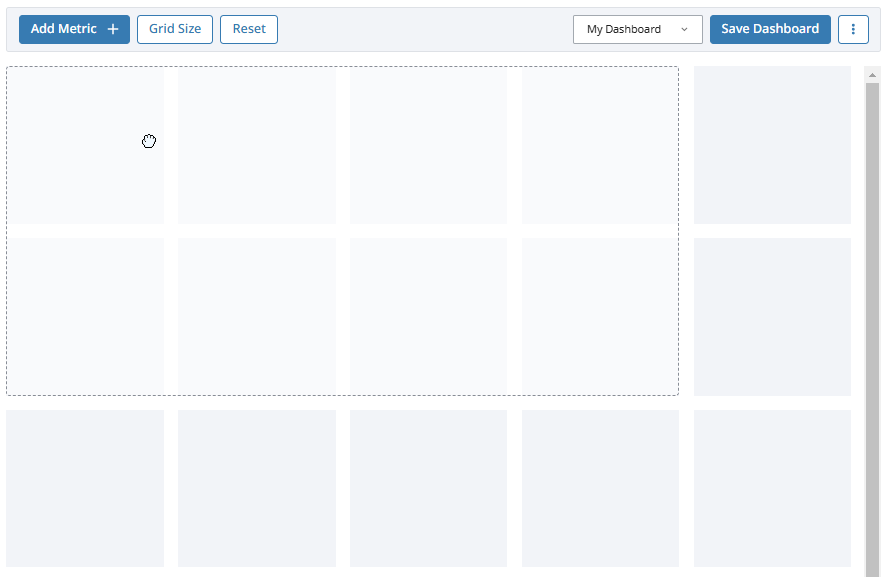
-
Click to snap the metric to the dashboard. To reposition your metric, you can drag and drop it anywhere else on the grid.
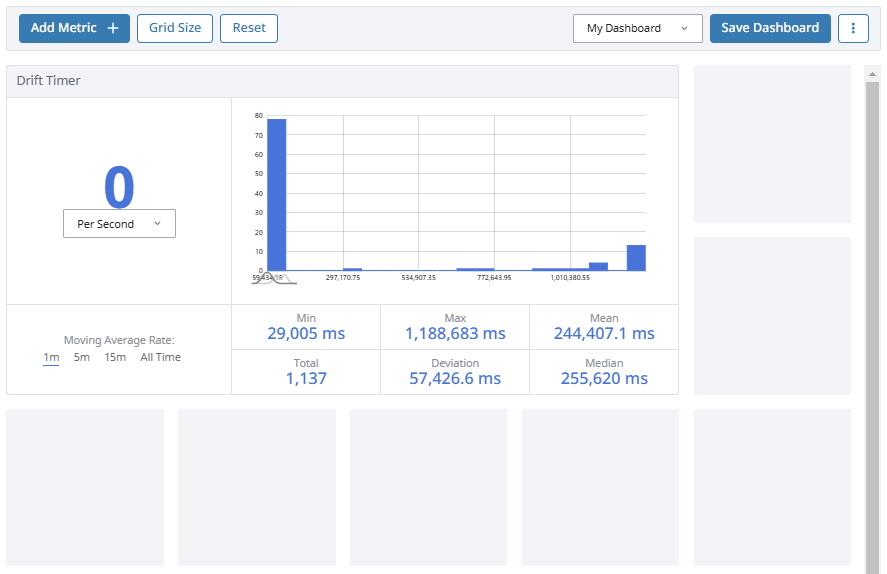
-
Click Save Dashboard on the top right when all desired metrics have been placed. If you are saving a new dashboard, you will be prompted to enter a name.