Diagnostics
The Diagnostics section displays information regarding the internal Gateway system, while giving you the ability to drill down into specific systems and get a more in-depth view of what is currently happening.
| Section | Description |
|---|---|
| Metrics Dashboard | Displays user-configurable dashboards featuring gauges, counters, meters, and other metrics visualizations. Available metrics include information about performance, tags, alarming, projects, and databases. |
| Logs | Displays errors caused by Gateway events like database or device connections, authentication profiles, alarm journals, and pipelines. Logs include a wealth of information about the running state of the Gateway. |
| Execution | Displays a status of all tasks that your Gateway runs on a schedule, such as duration and execution time of an alarm journal update or the average time it takes a Gateway to execute a Tag Group. |
| Performance | Displays information on the resource usage and overall health of your Gateway. |
| Scripts | Shows all actively running Gateway scripts, as well as all configured Gateway scripts. Running scripts can also be terminated from the Running Scripts page, while the Gateway Scripts page provides more detailed script information and log activity. |
| Threads | Shows what each thread is doing in the Gateway, including their state and CPU usages. |
Overview
The Diagnostics Overview page provides a visual synopsis of everything in the Gateway, as well as some basic information about the server Ignition is installed on.

There are six sections on the Overview page:
- Architecture
- Connections
- Performance
- Environment
- Systems
- Diagnostics
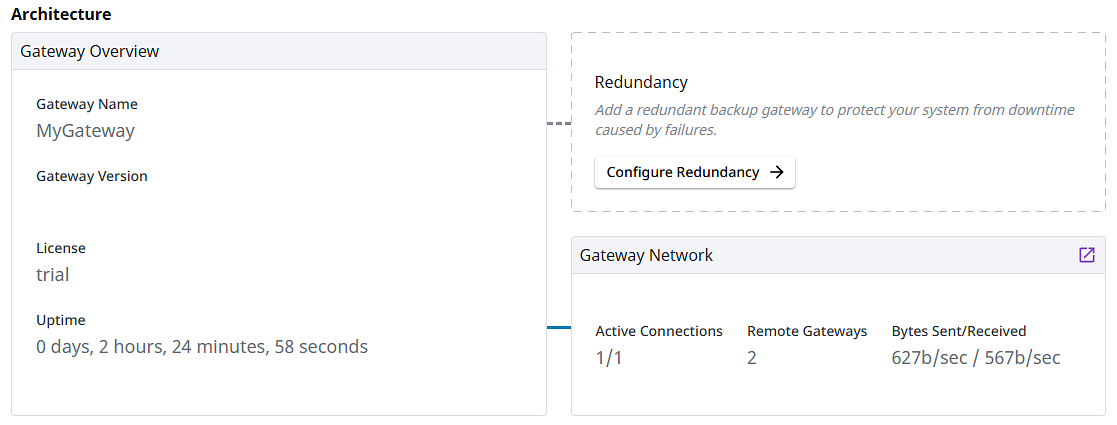
Architecture
The Architecture segment provides a top down view of your Gateway. You can see your Gateway name, Ignition version, license state, and uptime, as well as similar information with a redundant Gateway, if one is connected. You also get an overview of the Gateway Network including how many active connections there are, and what is the amount of data being transferred between them.
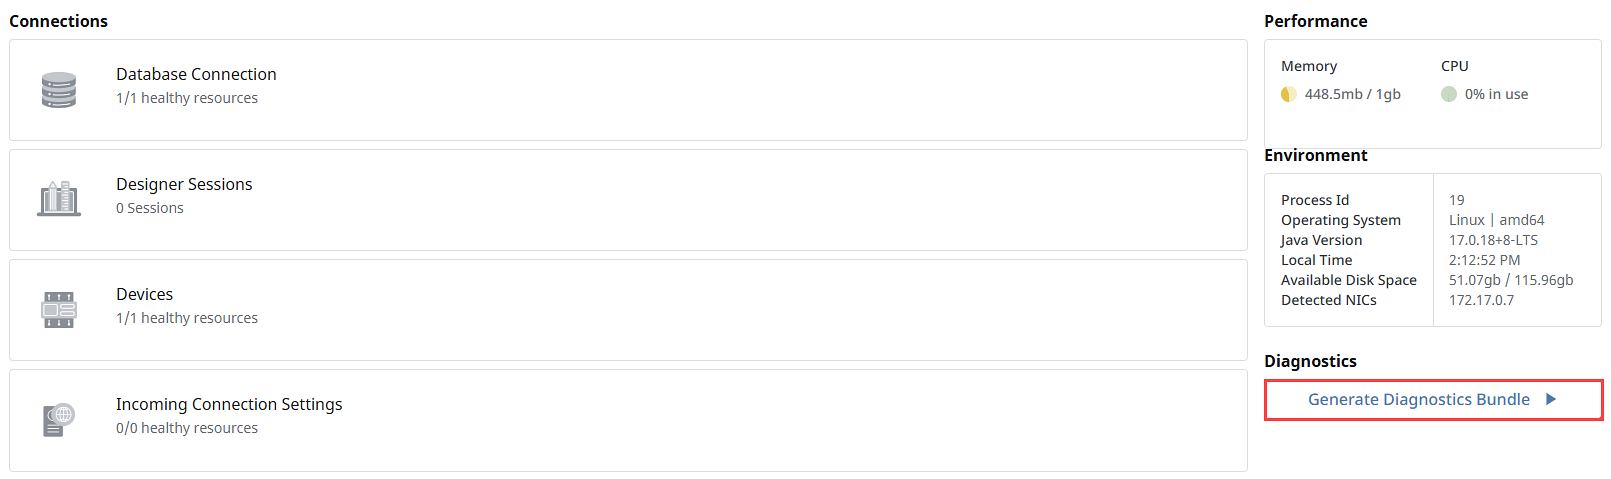
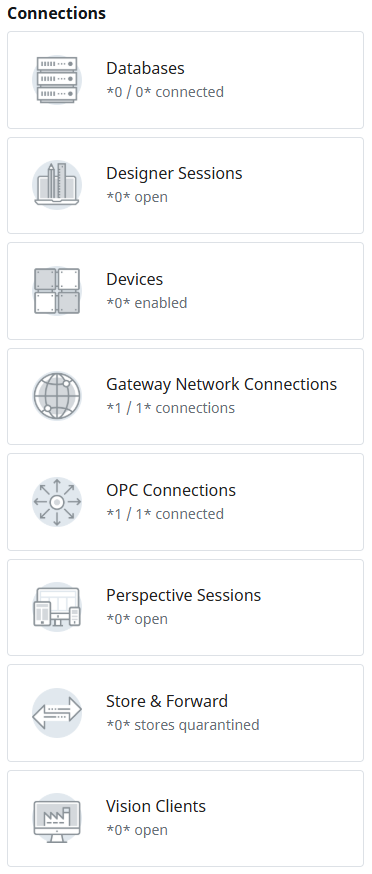
Connections
The Connections segment shows all of the systems that Ignition is connected to. If any of these have issues, they will be outlined in red. Click on the connection to be taken to the relevant page and view more information about the specified subsystem.
Performance
The performance segment displays memory and CPU usage within your Ignition system.

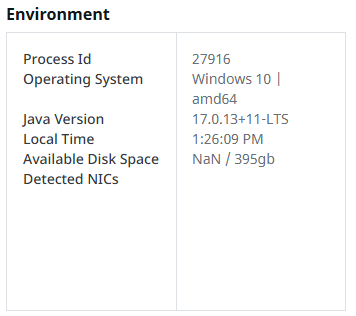
Environment
The Environment segment provides some basic information about your server such as the Operating System (OS), Java version, available disk space, and IP address of detected network interface cards (NIC).
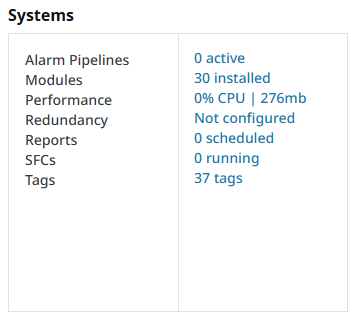
Systems
The Systems segment summarizes each of Ignition's systems. Here, you can see how many modules you have installed, as well as how many tags are configured in your Gateway, along with a handful of other information. Click on any of the linked system descriptions to find out more information about a particular system.
Diagnostics Bundle Export
The Diagnostics section contains an option to generate and download different sets of diagnostic information at once.
Exporting the Diagnostics Bundle with an increased number of wrapper logs and/or larger-sized wrapper logs may impact Gateway performance or cause the Gateway to restart.
The information included in a Diagnostics Bundle includes:
- Gateway Information
- Thread dump
- Wrapper log file(s)
- System log IDB
- Metrics IDB
- Memory dump
- Jetty server dump
- Gateway Network Diagram JSON
The memory dump will only be generated if the -Dignition.diagnostic-bundle.enable-memory-dump parameter is set to true, and available disk space is greater than or equal to twice the max heap size. For more information on adding this parameter, see the Gateway and Gateway Network Parameters page.