Performance
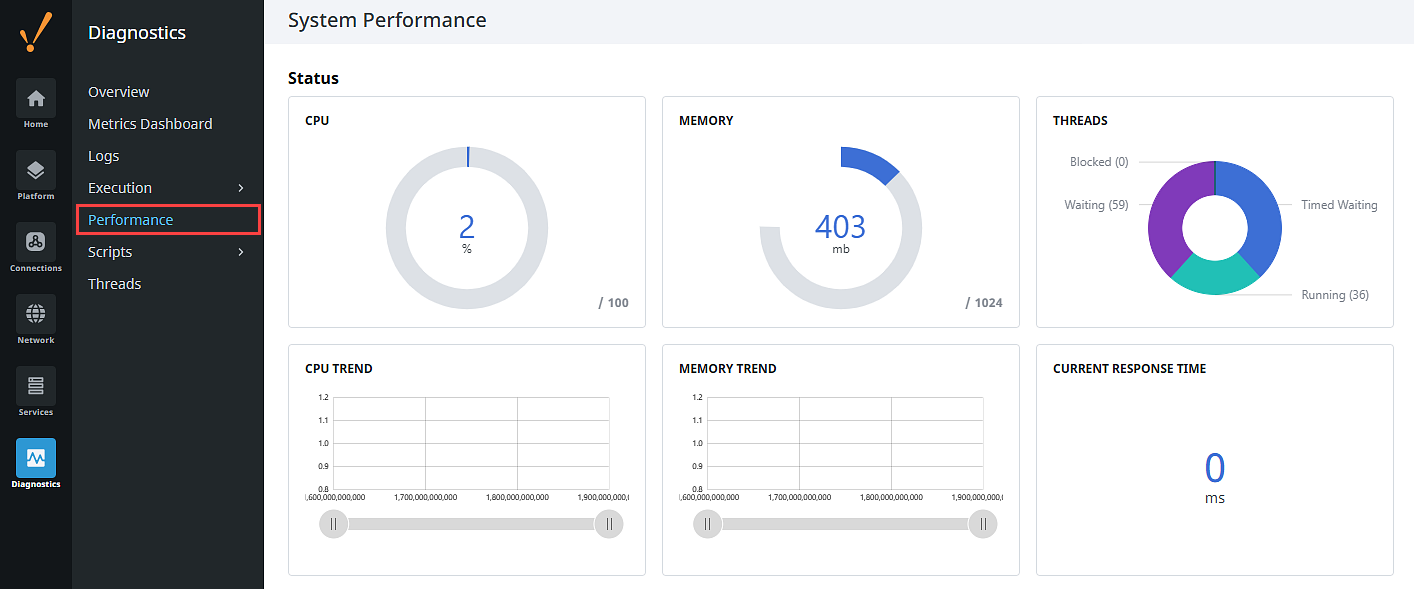
The System Performance page displays information on the resource usage of the Gateway. Select Diagnostics > Performance to access the Performance page. This page enables you to quickly assess your Gateway's overall health and determine if the Gateway is being taxed too heavily for the server it's running on.
You can see the current CPU usage, the current memory usage (in megabytes) out of the total allocated for the Gateway, how CPU threads are performing, and the current response time. In the CPU Trend and Memory Trend sections there are sliders you can move to set the time range anywhere within the previous 24 hours. The lower portion of the page lists any recent slow response events.