Threads
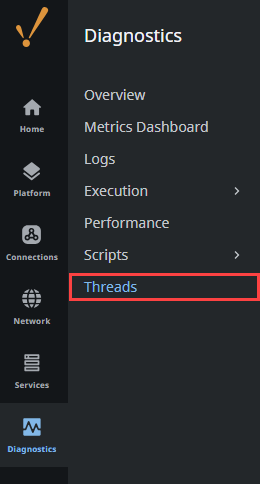
The Threads page displays a snapshot of information about Gateway’s execution threads. This information may be important when troubleshooting certain types of issues. If you are working with Support, you may be asked for a thread dump. Access the Threads page by navigating to the Diagnositcs tab of the Gateway and selecting Threads.
State and CPU usages are displayed to easily find problem threads. This page also shows a chart of what systems are using the threads and includes the ability to filter the threads based on a keyword. Each thread can be expanded to give details on what it is currently doing, and each thread process can be copied to the clipboard.
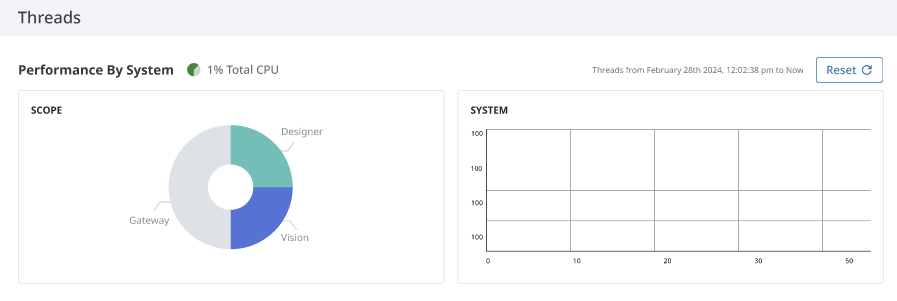
Thread Performance by System
The upper section of the Threads page depicts graphical representation of the current threads including percentage of total CPU used, overall scope, and average CPU usage per system. Click Reset in the upper right corner of the page to reset the information.
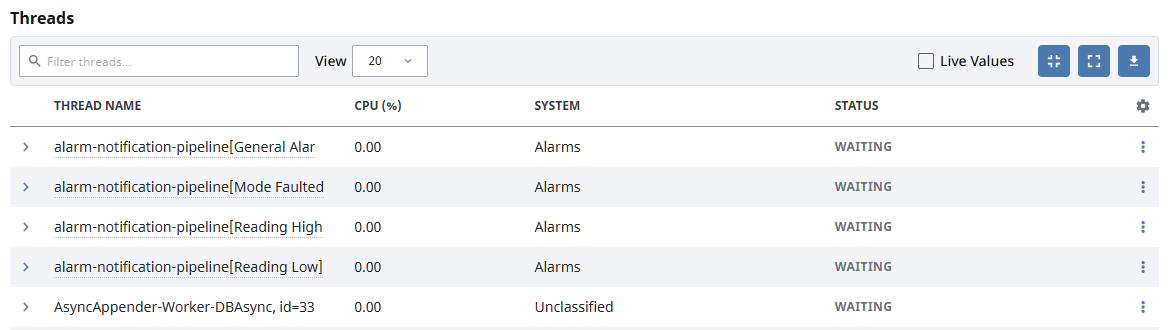
Individual Threads
The lower portion of the Threads page displays statistics for individual threads. Enter search criteria in the Filter Threads field to filter for specific threads.
To download a thread dump, click the Download ![]() icon on the right of the page. In order to be useful, a thread dump must be taken at the time the issue is observed. Unlike logs, which maintain a record of past messages, a thread dump is a time-specific snapshot and will not contain a record of past states. To see more information on thread dumps, including other methods of obtaining them such as system functions or the command line, click here.
icon on the right of the page. In order to be useful, a thread dump must be taken at the time the issue is observed. Unlike logs, which maintain a record of past messages, a thread dump is a time-specific snapshot and will not contain a record of past states. To see more information on thread dumps, including other methods of obtaining them such as system functions or the command line, click here.
| Attributes | Description |
|---|---|
| Thread Name | Name of the thread. |
| CPU(%) | Percentage of CPU usage. |
| System | Search criteria to filter for specific tasks or events. |
| Status | Current status of the system. |
Toggle the Live Values switch to turn live values on or off.
Click the Show ![]() icon to display additional details for a single thread. You can click the three dots menu
icon to display additional details for a single thread. You can click the three dots menu ![]() icon to copy that thread to the clipboard.
icon to copy that thread to the clipboard.
