Alarming
Alarming in Ignition is flexible and highly customizable to your needs. You can configure alarms with one alarm on a tag or multiple alarms on a tag using the Alarm settings in the Tag Editor. Alarms have multiple properties with values that can be assigned dynamically and they support filtering, shelving, notes, and separate pipelines based on alarm event states. Alarms can also be added to UDTs, so that every instance of a tag will automatically have alarms configured when created.
Once alarms are configured, components and module functionality can be utilized to display alarm states, track realtime alarm statuses and alarm history, and create Notification Pipelines with user roles, schedules, and On-Call Rosters to automatically inform necessary personnel of alarm statuses.
This page describes the possible alarm states and an overview of how these states can be shared and displayed. More information about configuring alarms can be found on the Configuring Alarms page.
Alarm Events
Alarm events are determined by how the source tag's value compares to configured alarm criteria, which is defined in the Alarm Mode settings. Each alarm event contains several attributes that store metadata about the source tag at the time the alarm event was created. Since tags can have multiple alarms configured on them, multiple alarm events can be created from a single value change on a tag.
Although alarms are monitored by the Gateway and considered Gateway-scoped, realtime alarm values can be monitored from Vision and Perspective using their respective Alarm Status Table components. In addition, the system.alarm.queryStatus function can be used to retrieve realtime alarm statuses.

Conditions
The state of an alarm event is determined by the Active or Acknowledged condition.
Active
Determines if the alarm is active, or "live". All alarm events start with an Active condition, and then move to a Cleared condition. Alarm events never transition from Cleared to Active. Instead, a new alarm event would be created should the value on a tag meet the alarm criteria.
- Active: The value on the source tag meets the setpoint configured on the alarm. If the alarm is used to signal that there's a problem, then the active condition means the problem is currently occurring.
- Cleared: The alarm event is no longer active. The value on the source tag no longer meets the setpoint configured on the alarm.
Acknowledged
Alarms feature an Acknowledgement functionality, which is a flag that can be marked on an alarm event. The Acknowledged condition is commonly used as a way for users to "claim" an alarm when multiple operators are monitoring alarm events, signaling to the others that the event is being handled.
Alarm event acknowledgement is generally performed using the Vision or Perspective Alarm Status Table components, or the system.alarm.acknowledge function.
- Unacknowledged (Unacked): The alarm event has not yet been flagged as Acknowledged.
- Acknowledged (Acked): The alarm event has been flagged as Acknowledged.
States
The two conditions above are combined to form one of four possible states of an event:
- Active and Unacknowledged
- Active and Acknowledged
- Cleared and Unacknowledged
- Cleared and Acknowledged
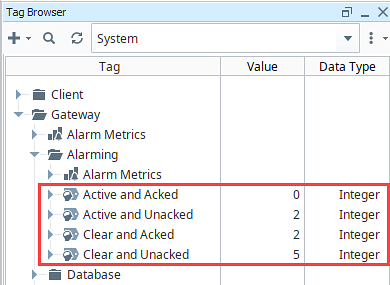
Alarming State Tags
Ignition provides a set of System tags to view information about the Ignition server, including four tags that count the number of alarms in each state. A quick way to see if any alarms are currently active and get an alarm count is to create Label components bound to these tags.
To view these tags, open the System Tag Provider in the Tag Browser of the Designer, and navigate to the Gateway > Alarming folder.
Filtering Alarms
The Perspective and Vision Alarm Journal Table and Alarm Status Table components, along with Alarm Journals on the Gateway, all contain filter properties to further determine which alarms appear or are logged.
By default, all alarms within the system are included, but in many cases it can be desirable to only show a subset of alarms. Strings can be entered in these fields, including wildcards, and you can enter multiple comma-delimited values to filter by. The filtering properties for components can also be bound so the paths are dynamically created.
Display Path
The default value for an alarm's Display Path is the tag path that leads to the name of the alarm. For example, if there is an alarm named High Alarm on a Ramp3 tag within a Ramp folder, the Display Path would be Ramp/Ramp3/High Alarm. However, the Display Path can be customized when configuring the alarm by entering the desired path into the Tag Editor > Alarms > Display Path field. This is generally utilized to display messages describing the issue the alarm is tracking.
To filter entries on the table by the Display Path, simply set a value on the Display Path Filter property. The * wildcard can be used in the Display Path string.
Source Path
The Source Path is also a path to the alarm, but it uses a different syntax and includes the Tag Provider the alarm is located in. If the name of the Tag Provider is Sample_Tags, then the source path using the same tag as the Display Path Filtering example would resolve to prov:Sample_Tags:/tag:Ramp/Ramp3:/alm:High Alarm. Unlike the Display Path, the Source Path on an alarm can never be overridden.
To filter entries on the table by Source Path, simply set a value on the Source Filter property. The * wildcard can be used in the Source Filter. See the Source Path Filter Examples table below for more use cases.
Source Path Filter Examples
Since the Source Path is made up of the alarm name, the tag path to the host tag, and the Tag Provider the tag resides in, the Source Filter property can be used to filter on tag folders and Tag Providers. For example, you may want the table to only show alarms that contain a certain term or folder path. The table below demonstrates some filters as well as some hypothetical results.
| Example Filter | Result |
|---|---|
prov:tagProvider:/tag:Inputs/PS_1:/alm:MyAlarm | Retrieve alarm information from the alarm at precisely the specified path: prov:tagProvider:/tag:Inputs/PS_1:/alm:MyAlarm |
*PS_1:/alm:MyAlarm | Retrieves alarm information from any path that ends with PS_1:/alm:MyAlarm. The following paths would be returned: prov:tagProvider:/tag:Inputs/PS_1:/alm:MyAlarm prov:tagProvider:/tag:anotherFolder/different_Path/PS_1:/alm:MyAlarm |
prov:tagProvider:/tag:PS_* | Retrieves alarm information from any source path starting with prov:tagProvider:/tag:PS_, such as: prov:tagProvider:/tag:PS_1:/alm:MyAlarm1 prov:tagProvider:/tag:PS_2/Tag2:/alm:MyAlarm2 |
*MyAlarm* | Retrieves any alarm information that has MyAlarm somewhere in the path. |
Shelving Alarms
Shelving an alarm tells the system that it should ignore the alarm, so that no alarm notifications are generated and all corresponding alarm events are hidden from the Vision and Perspective Alarm Status Table components. Shelving is useful to ignore alarms for a period of time, such as when maintenance is being performed.
There is always a duration associated with a shelved alarm, and new alarm events for this alarm are temporarily prevented. At the end of the shelving period, the alarm will evaluate its source tag, potentially creating a new alarm event.
Generating Alarm Notifications
Alarms can generate notifications, which then can be delivered to users to immediately communicate events and problems. Alarm Notification Pipelines control how and when notifications are sent to users. The delivery channel for how alarms are sent can be either Email, SMS, or Voice.
By designing your own alarm notification routing, you have control of what happens when an alarm goes active, when an alarm is sent out, and who receives the alarm notification. This is done through a drag and drop interface and the configuration of On-Call Rosters and Schedules.
The On-Call Roster is a collection of users to notify when an alarm occurs based on their active schedule. For example, the Roster Management component below shows a list of six available users approved to handle an alarm, but only three will receive the alarm notification since they are included in the On-Call Roster.

Utilizing this On-Call Roster in a simple Notification Pipeline could result in the logic shown below. When an alarm is triggered, the people listed in the On-Call Roster are notified via Email. If no one acknowledges the alarm in 20 seconds, the alarm notification is routed back to the same users listed in the On-Call Roster.

In a more complex Notification Pipeline, if an operator doesn't respond to the alarm after three attempts, the alarm jumps it to another pipeline, referred to as an escalation pipeline.

Viewing Alarm History
The Alarm Journal stores historical information about alarms in a database. It stores basic data about alarms that have occurred, such as their source and timestamp, associated data on an alarm, and the values of an alarm's properties at the time the event occurred. It captures all status changes for each alarm to an external SQL database of your choosing. To begin viewing alarm history, all you need to do is create an Alarm Journal Profile on the Gateway webpage.
Like the Alarm Status Table, both Vision and Perspective have components that can be used to view entries in an Alarm Journal.
