Comparison Charts
Overview
This page providers an overview of the various comparison charts in Ignition, or charts that allow you to compare difference sets of data. Comparison charts differ from trending charts in that they tend to utilize a timestamp to visualize records over a period of time. This page describes several types of comparison charts and how they are used.
Bar Chart
The Bar Chart is an easy-to-use chart that is driven by the Data property, and expects a specific format. The first column in the Data property defines the names of the categories, and each additional column defines the groupings for each item in the series (depending on the Extract Order).
Note, that additional datasets may not be added to the Bar Chart, so all values must be aggregated into the Data property via SQL Binding, or scripting. If multiple datasets are desired, then the Classic Chart configured with a bar renderer should be used instead.

Using the Bar Chart
Typically, data is pulled into the chart from a database using either a Named Query or SQL Query binding on the Data property. This data is typically category based, which typically means there is no timestamp. Generally, if values are split up by time, it is into large chunks of time, like the different months as shown in the example above.
Initial Dataset
When a Bar Chart is first created, the component will contain a dataset that looks like the following:
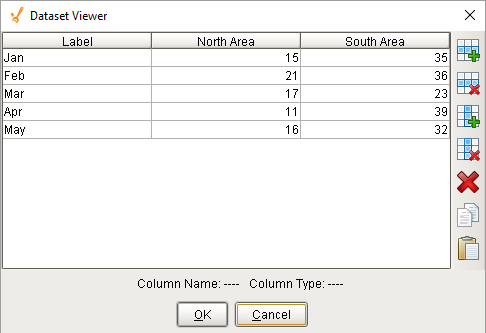
Bar Chart Sample Data
"#NAMES"
"Label","North Area","South Area"
"#TYPES"
"str","I","I"
"#ROWS","5"
"Jan","15","35"
"Feb","21","36"
"Mar","17","23"
"Apr","11","39"
"May","16","32"
Extract Order
The Extract Order property on the chart determines how data series are defined. By default, the property is set to By Row, which means each row is a series, and each column (except the first) is a category. Based on the initial dataset, datapoints are grouped by area (column) and then grouped by each month (row). If we set the Extract Order property to By Column, then we see that each data point is grouped by the month (row), and then grouped by each area (column). Note, that the underlying data has not changed, but rather how it is rendered as shown in the images below.

Chart
The Chart component, also known as the Classic Chart can be used to create many different types of charts by rendering the data in different ways. This means that depending on the type of data you have, you may use the Chart component in very different ways.
By default the chart is setup to be used as a time series chart, with default data that shows this behavior. However with the right data, the chart can also display an XY coordinate plot or a categorical plot.
Using the Chart
The default settings on the Chart allow it to be used as a time series chart. Simply alter the dataset in the Data property with new time series data to display it in the chart. You can also alter the renderer in the Dataset Properties to any of the XY renderers to change the way the data is displayed.
To use the chart as an XY coordinate plot, Data should be loaded with a two column dataset, where one column is the Y coordinate, and another is the corresponding X coordinate. The chart will also need to be setup with a new X axis, since the default axis is a date axis.
To use the Chart as a categorical plot, a few things need to change from the defaults. The Data property will need to be loaded with some categorical data. Categorical data will have one column of the dataset be categories of information in the form of a string. The chart will also need to be setup with a new categorical X axis, as well as a category renderer in the Chart Customizer. Lastly, the Chart Type will need to be a Category Chart. When the chart is a Category Chart type, the Extract Order property can be changed to alter how the data is pulled out and displayed in the chart. It works very similarly to the Bar Charts Extract Order seen above.
Initial Dataset
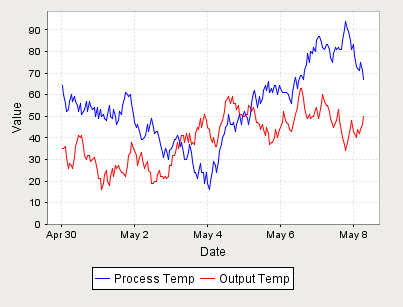
Each new Chart randomly generates a new dataset. This Data property will use the default timeseries behavior of the chart, with a t_stamp column for the domain, and two other columns (Process Temp and Output Temp) as values at the specified times.
Bar Chart Sample Data
"#NAMES"
"t_stamp","Process Temp","Output Temp"
"#TYPES"
"date","I","I"
"#ROWS","200"
"2018-04-30 00:07:15","64","35"
"2018-04-30 01:07:15","60","35"
"2018-04-30 02:07:15","56","36"
"2018-04-30 03:07:15","52","31"
"2018-04-30 04:07:15","53","26"
"2018-04-30 05:07:15","57","28"
"2018-04-30 06:07:15","60","27"
"2018-04-30 07:07:15","57","26"
"2018-04-30 08:07:15","59","31"
"2018-04-30 09:07:15","57","36"
"2018-04-30 10:07:15","55","39"
"2018-04-30 11:07:15","52","41"
"2018-04-30 12:07:15","56","40"
"2018-04-30 13:07:15","51","41"
"2018-04-30 14:07:15","52","36"
"2018-04-30 15:07:15","53","32"
"2018-04-30 16:07:15","57","30"
"2018-04-30 17:07:15","52","32"
"2018-04-30 18:07:15","57","32"
"2018-04-30 19:07:15","55","29"
"2018-04-30 20:07:15","53","30"
"2018-04-30 21:07:15","54","31"
"2018-04-30 22:07:15","50","29"
"2018-04-30 23:07:15","54","25"
"2018-05-01 00:07:15","49","21"
"2018-05-01 01:07:15","53","21"
"2018-05-01 02:07:15","50","16"
"2018-05-01 03:07:15","51","19"
"2018-05-01 04:07:15","49","23"
"2018-05-01 05:07:15","48","25"
"2018-05-01 06:07:15","51","20"
"2018-05-01 07:07:15","55","18"
"2018-05-01 08:07:15","50","22"
"2018-05-01 09:07:15","49","26"
"2018-05-01 10:07:15","53","22"
"2018-05-01 11:07:15","50","27"
"2018-05-01 12:07:15","46","26"
"2018-05-01 13:07:15","48","27"
"2018-05-01 14:07:15","52","26"
"2018-05-01 15:07:15","51","24"
"2018-05-01 16:07:15","55","24"
"2018-05-01 17:07:15","58","23"
"2018-05-01 18:07:15","61","22"
"2018-05-01 19:07:15","60","27"
"2018-05-01 20:07:15","59","32"
"2018-05-01 21:07:15","60","33"
"2018-05-01 22:07:15","56","38"
"2018-05-01 23:07:15","51","35"
"2018-05-02 00:07:15","47","34"
"2018-05-02 01:07:15","45","32"
"2018-05-02 02:07:15","46","27"
"2018-05-02 03:07:15","43","31"
"2018-05-02 04:07:15","39","33"
"2018-05-02 05:07:15","39","30"
"2018-05-02 06:07:15","40","26"
"2018-05-02 07:07:15","41","27"
"2018-05-02 08:07:15","46","29"
"2018-05-02 09:07:15","43","25"
"2018-05-02 10:07:15","47","24"
"2018-05-02 11:07:15","49","19"
"2018-05-02 12:07:15","45","19"
"2018-05-02 13:07:15","42","20"
"2018-05-02 14:07:15","43","20"
"2018-05-02 15:07:15","43","23"
"2018-05-02 16:07:15","39","25"
"2018-05-02 17:07:15","37","22"
"2018-05-02 18:07:15","33","22"
"2018-05-02 19:07:15","31","21"
"2018-05-02 20:07:15","35","22"
"2018-05-02 21:07:15","34","21"
"2018-05-02 22:07:15","30","22"
"2018-05-02 23:07:15","34","27"
"2018-05-03 00:07:15","35","27"
"2018-05-03 01:07:15","36","32"
"2018-05-03 02:07:15","39","32"
"2018-05-03 03:07:15","39","33"
"2018-05-03 04:07:15","41","38"
"2018-05-03 05:07:15","40","35"
"2018-05-03 06:07:15","36","39"
"2018-05-03 07:07:15","38","41"
"2018-05-03 08:07:15","33","41"
"2018-05-03 09:07:15","30","38"
"2018-05-03 10:07:15","30","42"
"2018-05-03 11:07:15","33","38"
"2018-05-03 12:07:15","37","42"
"2018-05-03 13:07:15","33","37"
"2018-05-03 14:07:15","29","38"
"2018-05-03 15:07:15","24","37"
"2018-05-03 16:07:15","24","42"
"2018-05-03 17:07:15","21","45"
"2018-05-03 18:07:15","24","44"
"2018-05-03 19:07:15","28","49"
"2018-05-03 20:07:15","24","45"
"2018-05-03 21:07:15","24","49"
"2018-05-03 22:07:15","19","51"
"2018-05-03 23:07:15","24","48"
"2018-05-04 00:07:15","19","45"
"2018-05-04 01:07:15","16","44"
"2018-05-04 02:07:15","20","40"
"2018-05-04 03:07:15","25","38"
"2018-05-04 04:07:15","29","40"
"2018-05-04 05:07:15","27","36"
"2018-05-04 06:07:15","24","36"
"2018-05-04 07:07:15","29","41"
"2018-05-04 08:07:15","34","45"
"2018-05-04 09:07:15","37","47"
"2018-05-04 10:07:15","40","48"
"2018-05-04 11:07:15","42","52"
"2018-05-04 12:07:15","45","57"
"2018-05-04 13:07:15","46","58"
"2018-05-04 14:07:15","51","59"
"2018-05-04 15:07:15","46","56"
"2018-05-04 16:07:15","46","59"
"2018-05-04 17:07:15","47","56"
"2018-05-04 18:07:15","43","56"
"2018-05-04 19:07:15","46","53"
"2018-05-04 20:07:15","49","55"
"2018-05-04 21:07:15","51","51"
"2018-05-04 22:07:15","46","51"
"2018-05-04 23:07:15","50","50"
"2018-05-05 00:07:15","52","50"
"2018-05-05 01:07:15","51","51"
"2018-05-05 02:07:15","49","51"
"2018-05-05 03:07:15","46","55"
"2018-05-05 04:07:15","51","54"
"2018-05-05 05:07:15","56","52"
"2018-05-05 06:07:15","61","54"
"2018-05-05 07:07:15","62","52"
"2018-05-05 08:07:15","57","47"
"2018-05-05 09:07:15","54","47"
"2018-05-05 10:07:15","59","46"
"2018-05-05 11:07:15","56","44"
"2018-05-05 12:07:15","58","46"
"2018-05-05 13:07:15","62","44"
"2018-05-05 14:07:15","64","41"
"2018-05-05 15:07:15","62","45"
"2018-05-05 16:07:15","66","42"
"2018-05-05 17:07:15","61","37"
"2018-05-05 18:07:15","63","38"
"2018-05-05 19:07:15","61","38"
"2018-05-05 20:07:15","64","40"
"2018-05-05 21:07:15","64","44"
"2018-05-05 22:07:15","60","40"
"2018-05-05 23:07:15","64","44"
"2018-05-06 00:07:15","63","45"
"2018-05-06 01:07:15","61","47"
"2018-05-06 02:07:15","61","52"
"2018-05-06 03:07:15","61","48"
"2018-05-06 04:07:15","61","47"
"2018-05-06 05:07:15","60","46"
"2018-05-06 06:07:15","58","44"
"2018-05-06 07:07:15","56","43"
"2018-05-06 08:07:15","61","45"
"2018-05-06 09:07:15","66","49"
"2018-05-06 10:07:15","68","51"
"2018-05-06 11:07:15","63","54"
"2018-05-06 12:07:15","66","58"
"2018-05-06 13:07:15","69","63"
"2018-05-06 14:07:15","69","63"
"2018-05-06 15:07:15","67","58"
"2018-05-06 16:07:15","71","54"
"2018-05-06 17:07:15","74","50"
"2018-05-06 18:07:15","79","49"
"2018-05-06 19:07:15","75","51"
"2018-05-06 20:07:15","80","49"
"2018-05-06 21:07:15","79","50"
"2018-05-06 22:07:15","82","50"
"2018-05-06 23:07:15","80","53"
"2018-05-07 00:07:15","85","54"
"2018-05-07 01:07:15","87","49"
"2018-05-07 02:07:15","87","51"
"2018-05-07 03:07:15","84","56"
"2018-05-07 04:07:15","82","60"
"2018-05-07 05:07:15","81","57"
"2018-05-07 06:07:15","83","55"
"2018-05-07 07:07:15","83","55"
"2018-05-07 08:07:15","81","52"
"2018-05-07 09:07:15","77","49"
"2018-05-07 10:07:15","75","46"
"2018-05-07 11:07:15","79","45"
"2018-05-07 12:07:15","82","47"
"2018-05-07 13:07:15","81","48"
"2018-05-07 14:07:15","82","53"
"2018-05-07 15:07:15","81","48"
"2018-05-07 16:07:15","81","43"
"2018-05-07 17:07:15","85","40"
"2018-05-07 18:07:15","90","37"
"2018-05-07 19:07:15","94","34"
"2018-05-07 20:07:15","90","38"
"2018-05-07 21:07:15","89","40"
"2018-05-07 22:07:15","85","45"
"2018-05-07 23:07:15","81","48"
"2018-05-08 00:07:15","83","43"
"2018-05-08 01:07:15","78","42"
"2018-05-08 02:07:15","73","40"
"2018-05-08 03:07:15","72","44"
"2018-05-08 04:07:15","71","42"
"2018-05-08 05:07:15","75","44"
"2018-05-08 06:07:15","71","46"
"2018-05-08 07:07:15","67","50"
Radar Chart
Radar Charts, also known as web charts, spider charts, and spider plots, are useful for displaying values that are out of spec, and several of them at once. Each value is plotted on a separate axis with the middle of the axis representing the ideal value. The chart draws a line between the different values, which create a shape that changes as those values change. Inside the chart, there is a polygon that represents what the chart would look like if all of its values were in their ideal range. A good use of radar charts is to display realtime information in such a way that outliers can be quickly identified. This can be an efficient way to convey if a process is running on-spec or off-spec at a glance. So the chart lets you quickly see where the values are in comparison to where they should ideally be.
Using the Radar Chart
The Radar Chart can be used to show realtime values by dragging and dropping Tags from the Tag Browser on to the chart. Doing so will create a Cell Update binding on the Data property that is tied to the Value, EngLow, and EngHigh properties on the Tag. Adding additional Tags will add additional spokes to the chart. Alternatively, a Named Query or a SQL Query binding on the data property can be used to display historical values, or aggregate previous historical values.
Initial Dataset
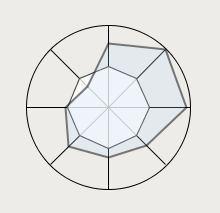
Each new Radar Chart randomly generates a new dataset. The Data property on the Radar Chart must have at least a Value, Min, and Max column. Any additional columns are ignored. To render properly, the dataset must have at least three rows. Datasets with only one or two rows will be drawn as a vertical line.

Min and Max��
The Min and Max column, aside from determining the limits on the the chart, are also used to determine the desired value. The Desired value is drawn as the midpoint between the Min and Max for a single row in the Dataset. Each row of the dataset has a Min and Max column -- the values in these columns are used to determine the scale of the spoke for that variable, with the midpoint representing the desired value.
Below we see the white polygon in the center of the chart. This represents the midpoint between Min and Max.

Radar Chart Sample Data
"#NAMES"
"Value","Min","Max"
"#TYPES"
"D","D","D"
"#ROWS","8"
"41.51196715968135","18.0","86.0"
"72.21343683086239","2.0","88.0"
"98.91484924220774","16.0","98.91484924220774"
"23.189112936965692","1.0","78.0"
"33.45468212322838","23.0","82.0"
"77.17126241429432","7.0","100.0"
"53.529302336166836","25.0","79.0"
"62.058120439146435","6.0","94.0"
Pie Chart
A Pie Chart displays values from several categories, each category is a separate "wedge" of the chart. The total is the sum of all wedges. The key to the Pie Chart component is the Data property, which contains the items that will be displayed as pie wedges.
Using the Pie Chart
Typically, data is pulled into the chart from a database using either a Named Query or SQL Query binding on the Data property. The data typically consists of a list of name-value pairs of things that are related.
Initial Dataset
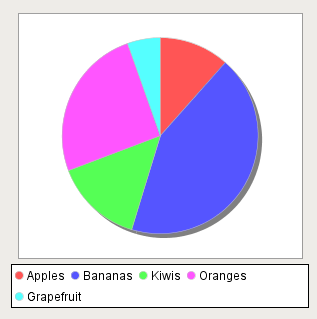
The Pie Chart component contains an initial dataset with two columns, Label and Value. As the name implies, the Label column determines the text associated with each wedge of the pie, while the value is the weight of the wedge.

Pie Chart Sample Data Extracted by Column
"#NAMES"
"Label","Value"
"#TYPES"
"str","I"
"#ROWS","5"
"Apples","15"
"Bananas","56"
"Kiwis","19"
"Oranges","33"
"Grapefruit","7"
Extract Order
When Extract Order is set to By Row, then the data must be formatted differently. This order expects each column to be a wedge. Note that only the first row is utilized when extracting by row: subsequent rows are ignored.
Pie Chart Sample Data Extracted by Row
"#NAMES"
"Grapefruit","Apples","Bananas","Kiwis","Oranges"
"#TYPES"
"I","I","I","I","I"
"#ROWS","1"
"7","15","56","19","33"
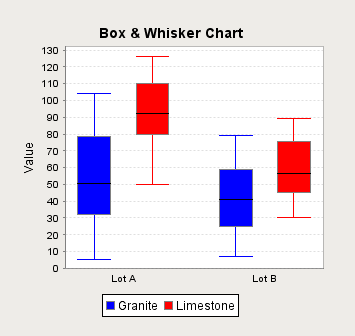
Box and Whisker Chart
A Box and Whisker Chart displays pertinent statistical information about sets of data. Each 'Box ans Whisker' item on the chart should represent a large amount of data: The high, low, median, and where the middle 50% of the data falls. The dataset that is required for this chart type will be all of your raw data, and it will calculate the box and whiskers for you.
Box Anatomy
- The upper and lower bounds of each box (the colored in parts) represent the 1st and 3rd quartiles (quarters of a dataset range). This means the space filled in by the box is 50% of your raw data.
- The horizontal line inside of the box represents the median (middle) value.
- The lines that stick out above and below the box (whiskers), represent the minimum and maximum values from the raw data.
Using the Box and Whisker Chart
Typically, data is pulled into the chart from a database using either a Named Query or SQL Query binding on the Data property. The data typically comes in categories separated by an optional key column, with each category containing multiple values.
Initial Dataset
The first column in the Box and Whisker Chart's dataset is the Key column. The Key column determines which series the data pertains to (domain lables). Values in the Key column are case sensitive. The second and additional columns denote categories (legend labels). The initial dataset contains two categories: Granite and Limestone. Additional columns in the dataset would add additional boxes to the chart.
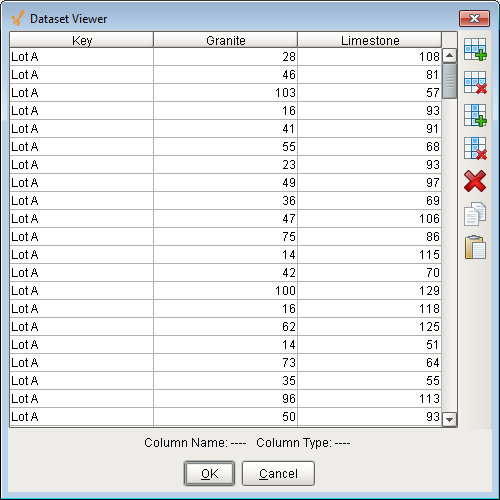
Box and Whisker Sample Data
"#NAMES"
"Key","Granite","Limestone"
"#TYPES"
"str","I","I"
"#ROWS","200"
"Lot A","28","108"
"Lot A","46","81"
"Lot A","103","57"
"Lot A","16","93"
"Lot A","41","91"
"Lot A","55","68"
"Lot A","23","93"
"Lot A","49","97"
"Lot A","36","69"
"Lot A","47","106"
"Lot A","75","86"
"Lot A","14","115"
"Lot A","42","70"
"Lot A","100","129"
"Lot A","16","118"
"Lot A","62","125"
"Lot A","14","51"
"Lot A","73","64"
"Lot A","35","55"
"Lot A","96","113"
"Lot A","50","93"
"Lot A","97","72"
"Lot A","7","80"
"Lot A","86","62"
"Lot A","87","78"
"Lot A","80","51"
"Lot A","100","94"
"Lot A","79","124"
"Lot A","39","107"
"Lot A","16","119"
"Lot A","20","60"
"Lot A","50","124"
"Lot A","37","50"
"Lot A","36","98"
"Lot A","46","77"
"Lot A","33","106"
"Lot A","49","75"
"Lot A","84","60"
"Lot A","17","94"
"Lot A","44","93"
"Lot A","72","105"
"Lot A","35","106"
"Lot A","20","119"
"Lot A","90","51"
"Lot A","37","88"
"Lot A","75","103"
"Lot A","13","104"
"Lot A","47","55"
"Lot A","65","126"
"Lot A","32","90"
"Lot A","85","126"
"Lot A","95","77"
"Lot A","74","123"
"Lot A","104","68"
"Lot A","90","109"
"Lot A","63","66"
"Lot A","60","90"
"Lot A","28","65"
"Lot A","64","69"
"Lot A","55","62"
"Lot A","98","64"
"Lot A","69","100"
"Lot A","35","110"
"Lot A","31","115"
"Lot A","51","106"
"Lot A","16","76"
"Lot A","91","93"
"Lot A","90","77"
"Lot A","93","64"
"Lot A","98","84"
"Lot A","61","95"
"Lot A","65","97"
"Lot A","67","54"
"Lot A","80","92"
"Lot A","104","123"
"Lot A","104","112"
"Lot A","20","71"
"Lot A","95","99"
"Lot A","37","98"
"Lot A","91","51"
"Lot A","101","106"
"Lot A","68","94"
"Lot A","9","96"
"Lot A","14","77"
"Lot A","46","95"
"Lot A","45","95"
"Lot A","79","90"
"Lot A","92","110"
"Lot A","29","80"
"Lot A","42","80"
"Lot A","15","126"
"Lot A","68","77"
"Lot A","69","98"
"Lot A","52","119"
"Lot A","11","72"
"Lot A","14","122"
"Lot A","36","115"
"Lot A","41","66"
"Lot A","98","73"
"Lot A","46","116"
"Lot B","49","75"
"Lot B","33","46"
"Lot B","53","32"
"Lot B","51","58"
"Lot B","34","81"
"Lot B","44","73"
"Lot B","71","43"
"Lot B","64","37"
"Lot B","58","77"
"Lot B","35","37"
"Lot B","76","88"
"Lot B","11","42"
"Lot B","11","64"
"Lot B","28","85"
"Lot B","26","58"
"Lot B","78","43"
"Lot B","43","69"
"Lot B","66","32"
"Lot B","7","42"
"Lot B","17","71"
"Lot B","59","68"
"Lot B","7","31"
"Lot B","53","48"
"Lot B","20","52"
"Lot B","71","58"
"Lot B","57","85"
"Lot B","14","61"
"Lot B","34","47"
"Lot B","59","74"
"Lot B","78","58"
"Lot B","64","81"
"Lot B","19","31"
"Lot B","43","48"
"Lot B","58","38"
"Lot B","22","48"
"Lot B","20","83"
"Lot B","36","61"
"Lot B","40","69"
"Lot B","64","50"
"Lot B","67","70"
"Lot B","46","36"
"Lot B","9","51"
"Lot B","10","41"
"Lot B","66","35"
"Lot B","46","44"
"Lot B","10","62"
"Lot B","13","35"
"Lot B","74","49"
"Lot B","69","64"
"Lot B","15","68"
"Lot B","56","38"
"Lot B","35","69"
"Lot B","61","37"
"Lot B","25","80"
"Lot B","38","89"
"Lot B","79","56"
"Lot B","6","64"
"Lot B","49","58"
"Lot B","5","54"
"Lot B","6","35"
"Lot B","38","75"
"Lot B","6","77"
"Lot B","39","36"
"Lot B","27","63"
"Lot B","72","78"
"Lot B","55","38"
"Lot B","9","36"
"Lot B","40","65"
"Lot B","57","76"
"Lot B","65","55"
"Lot B","74","81"
"Lot B","47","85"
"Lot B","66","84"
"Lot B","10","38"
"Lot B","23","53"
"Lot B","79","80"
"Lot B","27","58"
"Lot B","71","58"
"Lot B","27","32"
"Lot B","73","43"
"Lot B","24","57"
"Lot B","27","59"
"Lot B","56","30"
"Lot B","32","55"
"Lot B","7","40"
"Lot B","20","63"
"Lot B","68","74"
"Lot B","64","57"
"Lot B","57","31"
"Lot B","54","61"
"Lot B","33","35"
"Lot B","61","73"
"Lot B","36","61"
"Lot B","26","34"
"Lot B","9","59"
"Lot B","47","60"
"Lot B","61","86"
"Lot B","45","88"
"Lot B","5","87"
"Lot B","6","36"