Easy Chart - Subplots
To learn more, go to the Tag and Set up Tags to Log pages. The examples below use OPC tags from the Generic Simulator driver, but Memory, Expression, and Query Tags can be used instead.
Subplot Overview
The subplot feature of the Easy Chart component allows you to break up the chart plot area into multiple distinct subplots sharing the 'X' axis, but they each have their own 'Y' axis. It is a good way to display lots of data from different Tags in one Easy Chart.
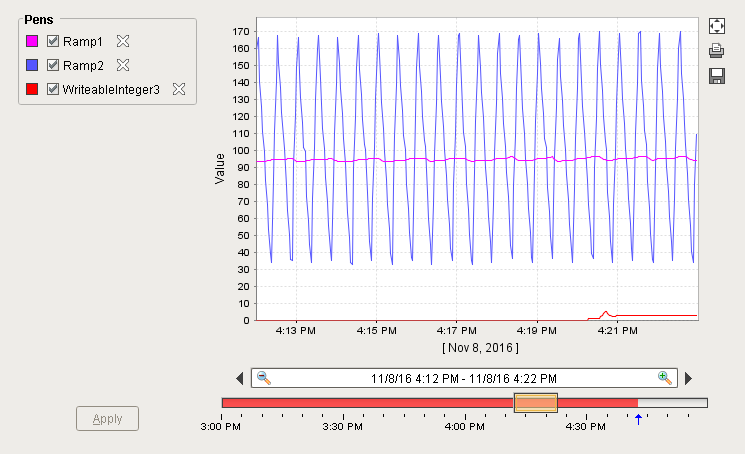
By default, the Easy Chart has one subplot which is the main white area. In this example, there are three Tags inside the chart, yet it's difficult to see the details of the data. It’s possible to break up your Tags into multiple subplots which is often useful for discrete data.
Configuring Easy Chart Subplots
For each Tag in the Easy Chart example above, let's create its own subplot so the data is easier to view and analyze.
-
Right click on the Easy Chart component, and scroll down to Customizers > Easy Chart Customizer. The Easy Chart Customizer window will open displaying three Tags. Click on the Subplots tab.
-
The Subplots tab lets you add one or more subplots to the Easy Chart. Create two more subplots by clicking the green plus icon
 two more times.
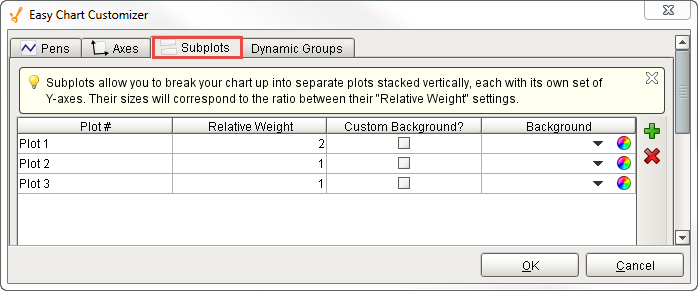
The size of each subplot corresponds to the ratio between their "Relative Weight" settings. By default, each subplot is assigned a Weight of 1, meaning each subplot will share an equal percentage of space on the chart. In this example, Subplot 1 has a weight of 2, and subplots 2 and 3 have a weight of 1. Subplot 1 is going to be 2 times larger than Subplots 2 and 3.
-
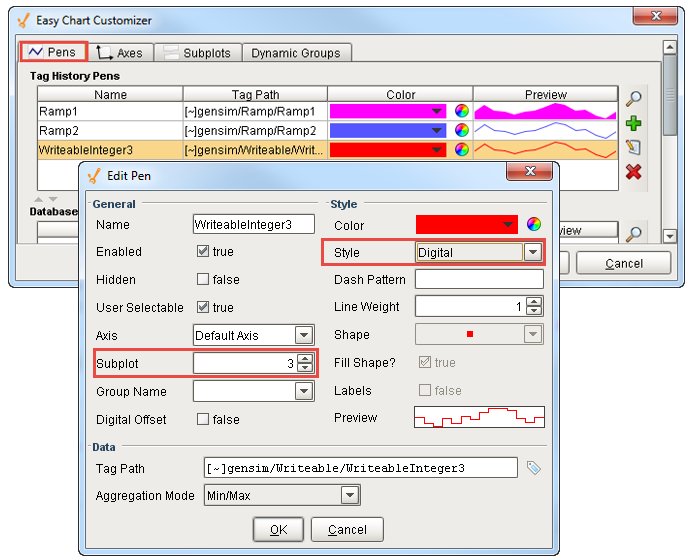
Once you add the subplots, put each of the different pens into a different subplot. Click on the Pens tab, select the Pen row, and click the Edit Pen icon
 . In the Subplot field, use the dropdown to select the subplot number.
If you would like to change the style of how the data is presented in the subplot, click the dropdown list next to Style, and choose from the several style options available. Click OK.
Repeat this step for each one of your pens, then press OK.
 Customizing a Pen
To learn more about customizing a pen to change its style, shape, weight, and color, refer to Easy Chart - Pen Renderer.
-
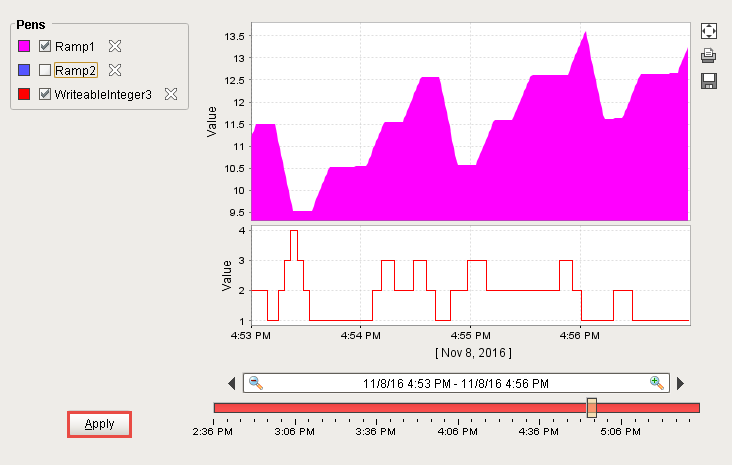
Now, you have three distinct subplots on one Easy Chart. There is no limit to the number of subplots on one Easy Chart.
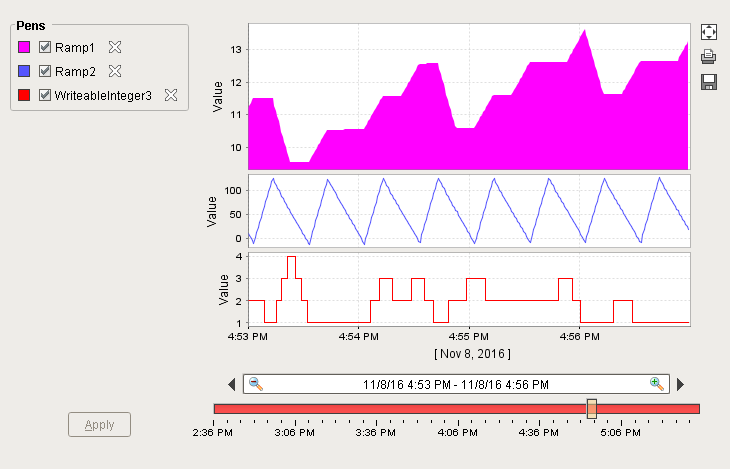
-
You can be selective about what subplots you want to view. Go to Preview Mode, uncheck the Pens you don't want to see, and click Apply. Notice how the Ramp 2 Pen is unchecked and is no longer displayed on the Easy Chart. To add the Ramp 2 pen back to the Easy Chart, check the Ramp 2 pen, and press Apply. The Easy Chart only shows subplots that have active Tags.