Charting - Right Click Menu
Right Click Menu Functions
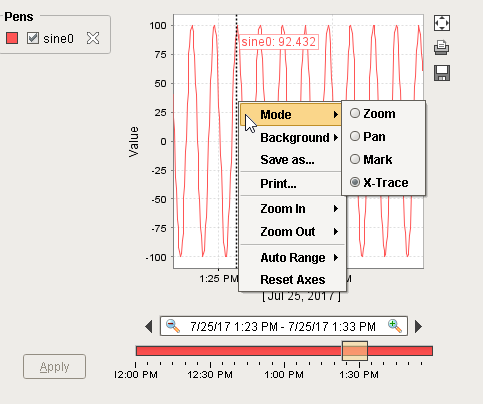
When viewed from the client (or the Designer's Preview Mode) many chart components, such as the Easy Chart or Bar Chart, allows users to right-click and access a menu with additional features. Explanations of these features are listed below.
Note that many of the behaviors listed below may be overridden by a property on the parent component. For example, the Easy Chart provides a way to define the plot background color with the Easy Chart Customizer, so the Background options on the right-click menu would not modify the behavior on the component when the user selects them.
| Item | Description |
|---|---|
| Mode | Specifies the functionality of a left-click on the chart. The following modes are available:
|
| Background | Allows the user to change the background color. Available options include Black and White. |
| Save as... | Provides a Save window that allows the user to save a PNG of the chart locally. |
| Print... | Provides a Print dialog that allows the user to print an image of the chart. This will send the chart to a physical printer. Note: a printer must be installed on the client computer. |
| Zoom In | Allows the user to Zoom in on the chart. There are three possible options:
|
| Zoom Out | Allows the user to Zoom out on the chart. There are three possible options:
|
| Auto Range | Automatically updates the range, or viewable space, on the chart to incorporate all data points. As mentioned above, many components have properties/customizations that restrict the capability of these (such as the date range on on the Easy Chart).
|
| Reset Axes | Adjusts the Axes back to their initial state. |