Easy Chart - Pen Renderer
Customizing the Pen Renderer
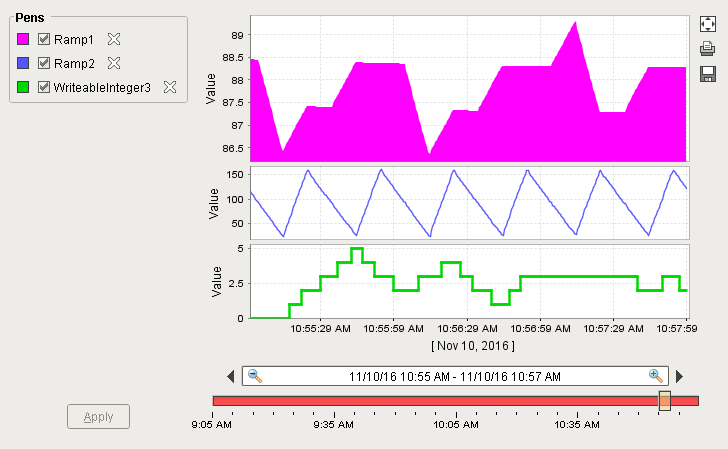
You can customize the renderer of each pen on the Easy Chart to change its style, shape, weight and color. When adding Tags to an Easy Chart component, the default renderer or style of each pen is a simple line, but it can be customized for each pen.
-
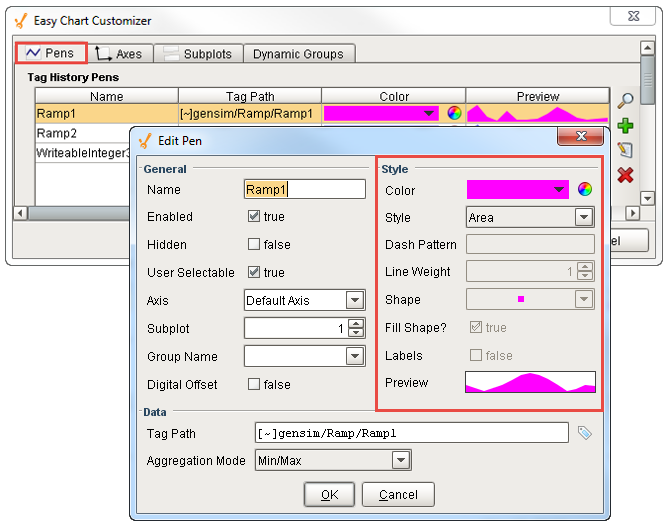
To customize the pen renderer, right click on the Easy Chart component, and scroll down to Customizers > Easy Chart Customizer.
-
From the Pens tab, select the pen row, and click the Edit icon. The Edit Pen window will open. On the right side of the Edit Pen window under Style, you can change the line color, style, weight, and shape. The line style, by default, is ‘Line with Gaps,’ which means that if you lose communication to the PLC or don’t have data for a particular time period, you will see a gap. You can change the Style from ‘Line w/ Gaps’ to any other style type listed in the dropdown that fits your needs and preferences.
-
Edit each style property. If you don't like the result in the Preview window, select another style. You can edit it as many times as you like. When you're finished, press OK.
-
Repeat steps 2 and 3 to customize the renderer for all the pens you want to change. When you're finished, press OK.
-
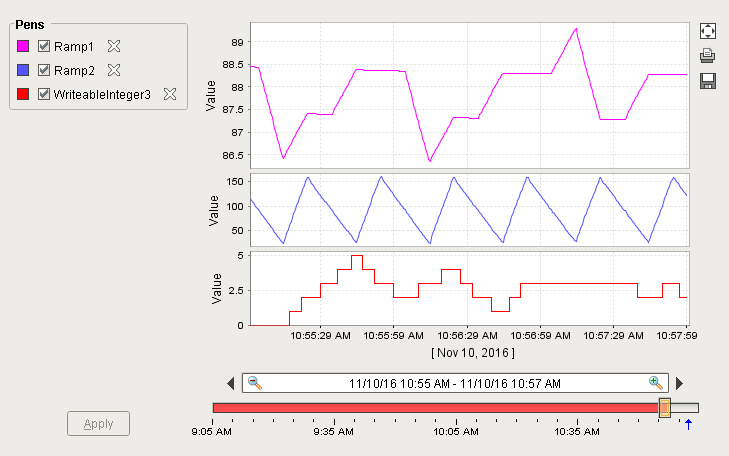
Notice how all the pens on your Easy Chart now reflect your style changes, and how easy it is to customize the style for each of your pens.