Report Data
Data
The most critical part of any report is data. Without data, there is nothing to report! In the Reporting Module, all data is collected as either a Parameter or a Data Source, and it is all configured in the Data tab of the report. Clicking on the plus (![]() ) button allows you to add new sources of data, bringing up a menu so you can choose the type of data to add. If a Parameter or Data Source is highlighted, clicking the trashcan (
) button allows you to add new sources of data, bringing up a menu so you can choose the type of data to add. If a Parameter or Data Source is highlighted, clicking the trashcan (![]() ) button will delete that particular source of data.
) button will delete that particular source of data.

Order Matters
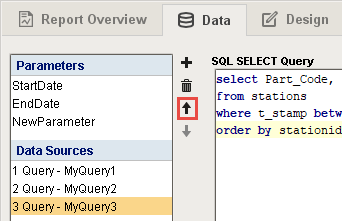
The order of the Parameters and Data Sources is important. In some cases, a parameter or data source may have the capability to reference the results of another type, such as a Parameter referencing the value of another Parameter. Parameters and Data Sources may ONLY reference other types of data that are listed vertically above them in the list. In short, the bottom-most Data Source may reference all other parameters and data sources, while the top-most Parameter may not reference any other parameter or data source.
Because of this, it is possible to reorder them using the up (![]() ) and down (
) and down (![]() ) arrow buttons.
) arrow buttons.
Parameters
Parameters are the way you get dynamic data into your charts. These properties are exposed on the Report Viewer component and can be bound to other components to allow your users to select what report data they want to see. You can use these to set up dates, time ranges, area selectors, titles, and anything else you want in your report.
By default, StartDate and EndDate properties are automatically created for you because they are almost always used to filter report data. You can, of course, delete them if you don't need them.

Data Sources
Data Sources are the primary means of getting data out of where it lives and into a report. There are eight Data Sources included in the Reporting Module: six Query types, a Script data source and Static CSV. Each data source offers a unique method of collecting (or amending in the case of Script Source) data. Aside from the Script datasource, all will require you to specify a Data Key. The Data Key is a unique identifier that represents the top-level of the data collected through this source – think of it as the label for the data source, or as the parent node of your source's collected 'data tree'. When your report is generated, the data collected under this identifier is passed to the reporting engine, which utilizes this identifier to appropriately place your data in the final report.
Here is a complete list of all the Data Source types:
- Named Query: A pre-configured query that runs as a prepared statement. If your Gateway is already using Named Queries to display data, then you can easily add those queries to your report.
- SQL Query Data Source: a straightforward query that allows parameters to be inserted with question marks (?) and has a graphical Query Builder.
- Basic SQL Query: a simplified version of the SQL Query that supports references directly in the query using the brace characters .
- Tag Historian Query: the same Tag History query builder you are familiar with from property bindings.
- Tag Calculation Query: similar to the Tag Historian query, but this one allows calculations to be performed on the resulting data (min, average, duration on, count off, etc.).
- Alarm Journal Query: the same alarm journal query builder you are familiar with from the Functions property binding.
- Script: a blank script that you can use to create a dataset in any way you like.
- Static CSV: copy and paste static CSV data directly as an easy way to test your reports.
Give your Data Keys readable names that say something about the table or data they represent. This will make it easier to build meaningful reports!
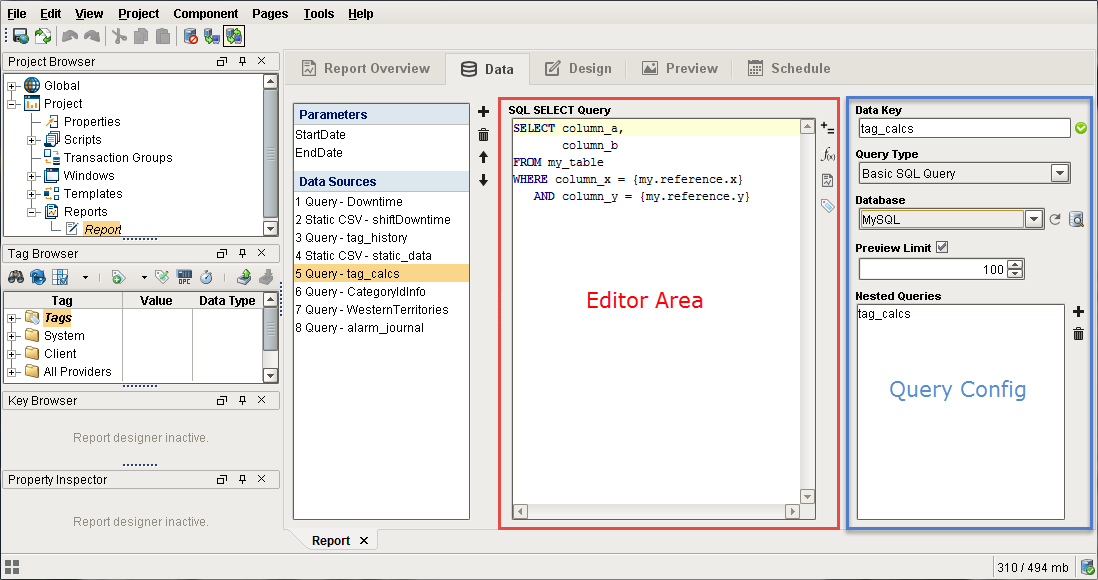
The Query data source types share some common features in the UI, and they all return what is essentially a Dataset. If you take a look at the image below, you'll see we outlined two main areas of the Basic SQL Query data source type. By default, the largest part of any Query panel is taken up by the central Editor Area. This space is tailored for each query type. On the right side of the Data panel, we have a "Query Configuration" area. In the screenshot, you'll see there are options for the Data Key, Query Type, Database, Preview Limit and Nested Queries. Of these, Data Key, Query Type and Nested Queries are shared among all Queries, while Preview Limits are conveniently available in SQL query types. Here is some brief information on each type:
- Data Key- The identifier we will reference when we design our reports. The Data Key needs to be unique, can not contain special characters (spaces, underscores, dashes are allowed), and must start with a letter. We added a convenient validator to help detect name collisions.
- Query Type - gives you a convenient place to change the type of query.
- Nested Queries - All of the query-based Data Source types can have nested queries in them. That is, for each row of returned data, a second query can be run based on the results in that row. You can have multiple sub queries for each row, and nest queries as deep as you want. This is particularly useful when you have data organized into runs and want to see historical data for each run.
- Preview Limit - Allow you to choose to limit the number of rows returned from a query when a report is being generated in the Preview Panel, and when data is sampled for the purposes of generating Data Keys in the Designer. If supported by your database, this makes it much easier to craft and preview deep query structures without the overhead and wait-times of long-running queries.