10. Create a Graph
You can see the Tag History data we just created by adding a graph to a window. Your graph can include subplots, axes, and a moving average pen. You can view the runtime data in realtime or historical mode.
Create a Graph
-
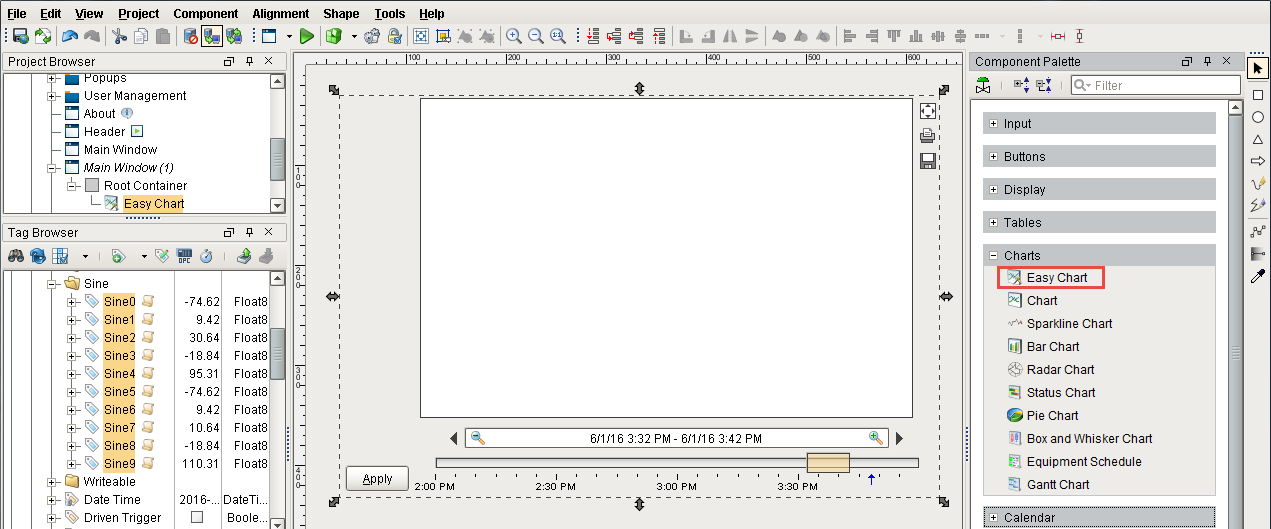
Open your Main Window. From the Charts section of the Component Palette, drag in the Easy Chart component.
We can add the tags to the graph the same way we created the status and control windows through drag and drop.
-
Drag all the Sine tags from Tags Browser to the graph.
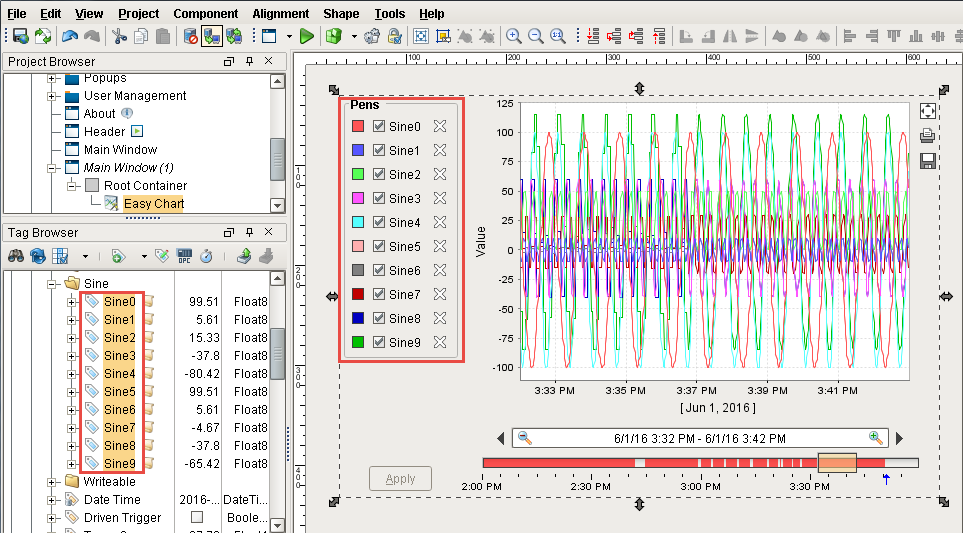
The tags are displayed on your Main Window but because you have just started logging data, not much data will show up.
-
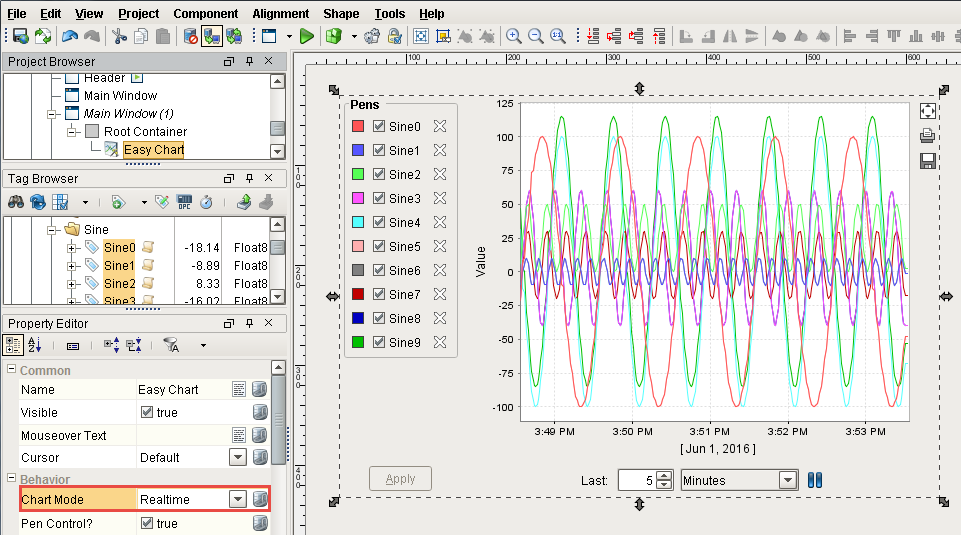
To show more data, set the Chart Mode property of Easy Chart to Realtime.
That's it! Now open your client and view your windows.