Diagnostics
Diagnosing Gateway Issues
The Diagnostics section of the Status tab holds pages that help to diagnose issues with the Gateway. The Gateway logs can be seen here as well as information on any blocked threads within the Gateway if something has gotten stuck. The logging system also ties into the logs in any previous status pages.
Execution
The Execution page reports the status of all tasks that your Gateway runs on a schedule. Here you can find helpful information such as the duration and execution time of an alarm journal update or the average time it takes your Gateway to execute a scanclass.

Logs
One of the most important troubleshooting tools of the Gateway Webpage is the Logs page. This console shows errors caused by Gateway events including things like Database or Device connections, Authentication profiles, Alarm Journals and Pipelines, and anything else that is Gateway scoped. You can find logs in the Status section of the Gateway Webpage under Diagnostics > Logs.
The Gateway Logs also provide a wealth of information about the running state of the Gateway. To learn more, refer to the section on Troubleshooting the Gateway.
The Logs page is where the Gateway Console is located that allows you to see a live flow of log events in the system. The logs can be filtered by using a search term or by date. The Settings ![]() button on the right brings up a popup window that can change the logging level of certain loggers. The logs can also be exported using the Download Logs button on the right as well.
button on the right brings up a popup window that can change the logging level of certain loggers. The logs can also be exported using the Download Logs button on the right as well.

Mapped Diagnostic Context Keys
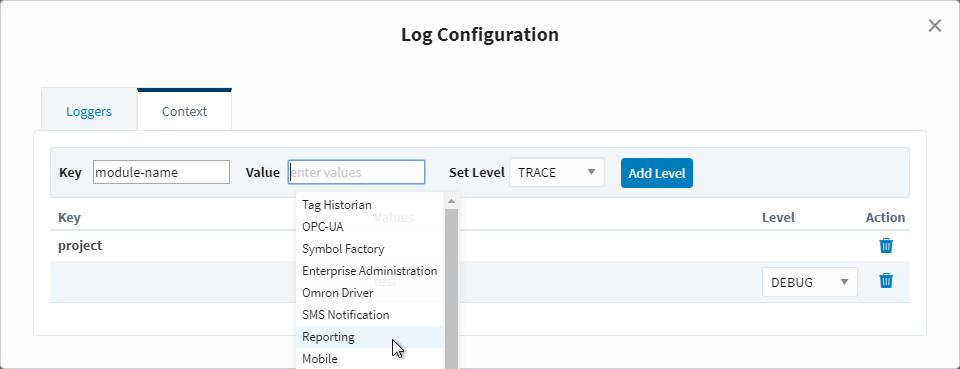
Mapped Diagnostic Context Keys (MDC Keys) allow you to specify a specific context, such as a particular project, and then set a logging level for it. This will set all loggers that pertain to the specified project to the logging level. This is useful to help diagnose an issue with a specific system within the Gateway. To use MDC Keys, click the Settings ![]() button on the Logs page and navigate to the Context tab. Here, you can choose specific Key-Value pairs that match a particular system. Selecting the Key text field will bring up a list of possible keys in your system. Once a Key has been selected, selecting the Value text field will bring up a list of possible values that relate to the selected Key.
button on the Logs page and navigate to the Context tab. Here, you can choose specific Key-Value pairs that match a particular system. Selecting the Key text field will bring up a list of possible keys in your system. Once a Key has been selected, selecting the Value text field will bring up a list of possible values that relate to the selected Key.
The Logs can also be filtered to show only logs that pertain to an MDC Key. This can be useful when altering the logging level of one or more MDC Keys. To set an MDC Filter on the logs, simply click the Add Mapped Diagnostic Context Filter button ![]() on the Logs page to open a window where MDC Key Filters can be set. The filter can be specified for all values in a Key by not specifying a Value.
on the Logs page to open a window where MDC Key Filters can be set. The filter can be specified for all values in a Key by not specifying a Value.
Merging to Logs
Many of the other pages in the Status tab also contain a logger that will just show logs that are relevant for that particular section. These log views all contain a button on the right side called Merge to Logs. This button allows the current filter to be applied to the main logs page, allowing you to still see only the logs for that section but use all of the tools available.

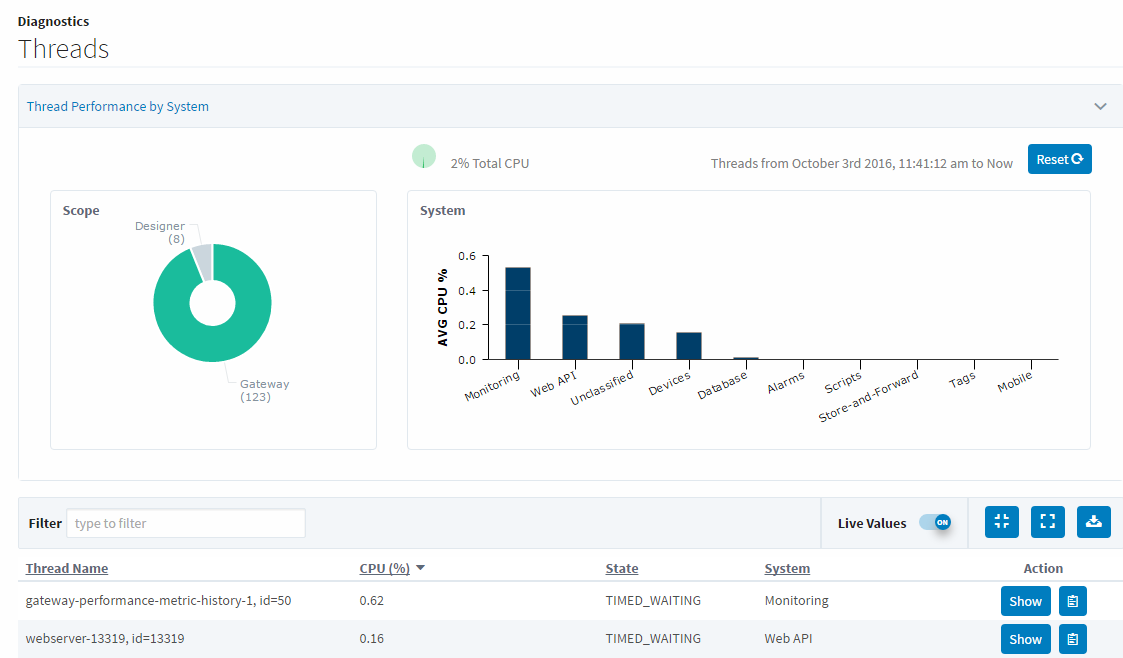
Threads
The Threads page allows you to see what each thread is doing in the Gateway. Their state and CPU usages are displayed to easily find problem threads, as well as a chart of what systems are using the threads and the ability to filter the threads based on a keyword. Each thread can be expanded to give details on what it is currently doing, and that individual thread process can be copied to the clipboard. A thread dump can be downloaded by clicking the download button on the right of the page.