Report Designer Interface
Reports Workspace and Workflow
Built from the ground-up to be intuitive and familiar, the Reporting workspace has a logical workflow which makes it easy for anyone to create meaningful reports. The reporting workspace has five panels which make up the workflow of a report: Report Overview, Data, Design, Preview, and Schedule panels.
Let's take a look at each panel of the Reporting workflow.
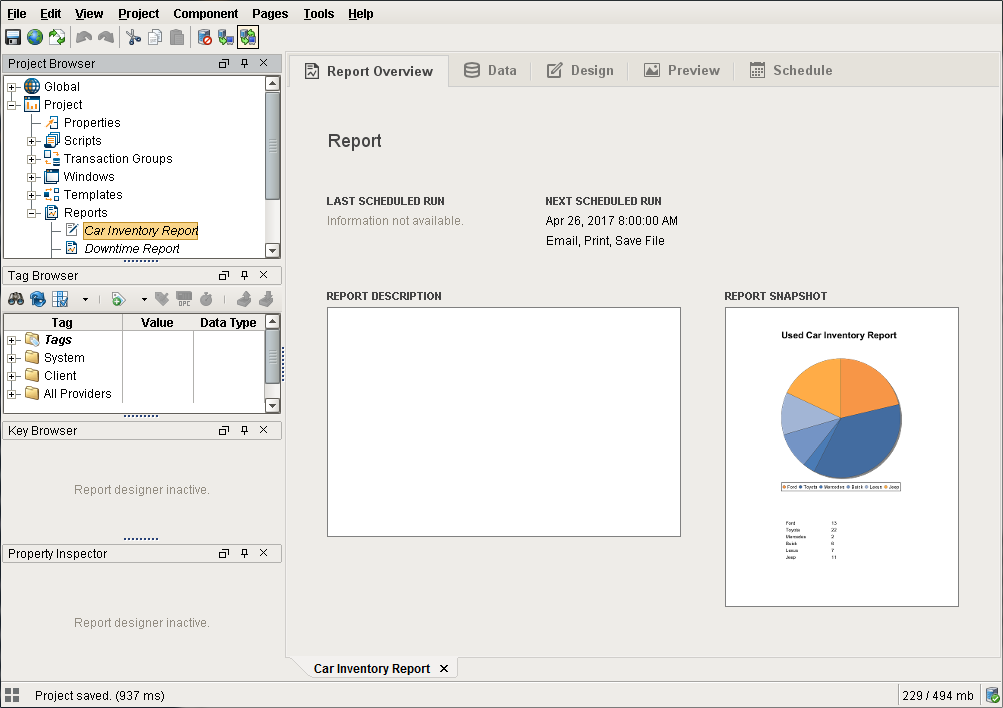
Report Overview Panel
The Report Overview panel should be fairly self-explanatory – it provides some valuable quick-glance information about your report. There is space to add notes, which is a good place to provide background information and context about the report. The Overview will also show a thumbnail of the most recent report, its last execution time, and the next scheduled execution. The Report Snapshot is generated per visit to the Preview Panel.
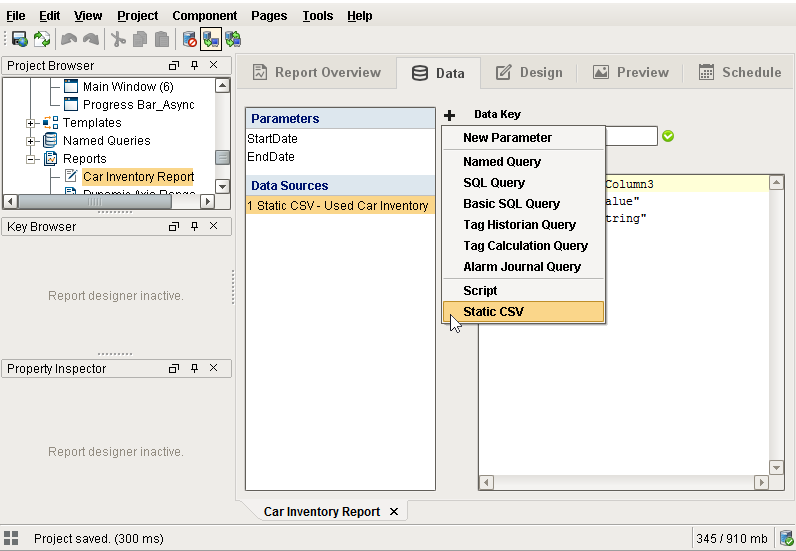
Data Panel
The Data panel is the first stop for configuring a new report. You'll notice the list on the left that has labels for Parameters and Data Sources, as well as some buttons. On this page you can generate data that you want to make available on your report. We'll dive more into Parameters and Data Sources, but for now go ahead and click the (![]() ) icon. You'll see a list of built-in Data Sources and Parameters. Selecting any one of them will open the configuration screen for that Data Source type and allow you to start configuring the data you'll supply to your report.
) icon. You'll see a list of built-in Data Sources and Parameters. Selecting any one of them will open the configuration screen for that Data Source type and allow you to start configuring the data you'll supply to your report.
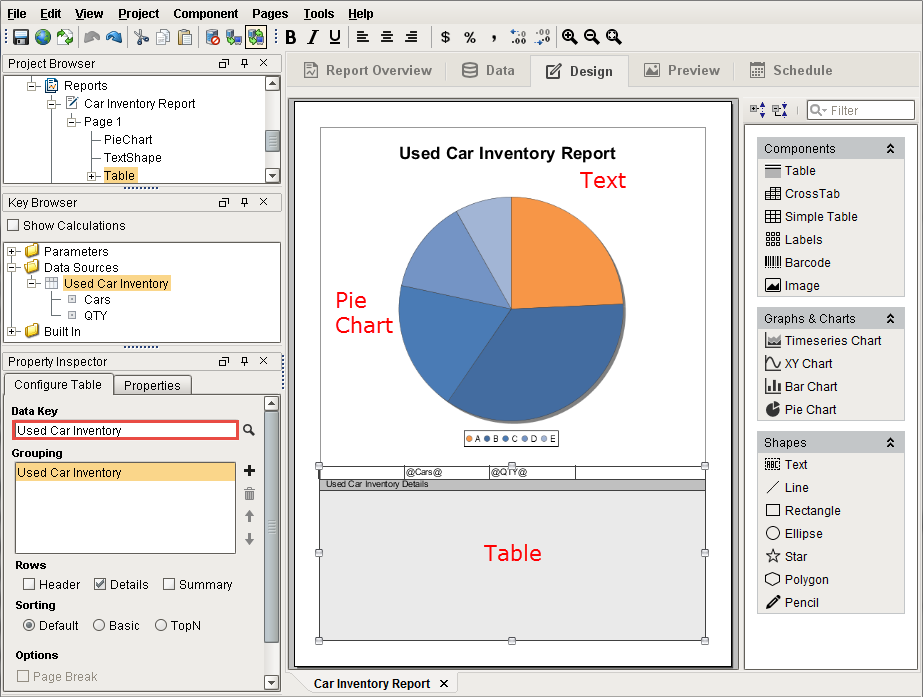
Design Panel
If you've ever designed a Vision Window, the Design panel should make you feel right at home. Starting from the top-left – the structure of a Report is now represented in the Project Browser tree, allowing easy visualization of the tree of elements on your report, but don't stop there! Grab a component off the vision-like reporting palette on the far right and add it to the page. For complex components, there are configuration panels in the Property Inspector to supplement the Property Inspector table that all the design objects have. In place of the Tag Browser, there is a Key Browser that gives you an easy way to add the Data Sources and Parameters that you configured in the Data panel to the Report.
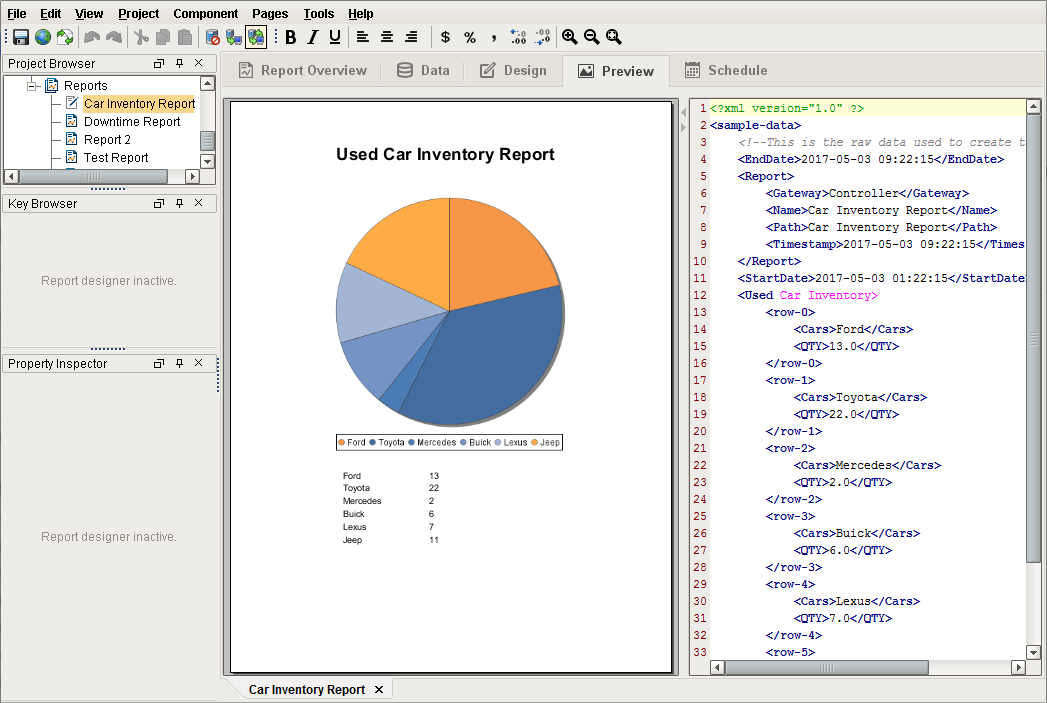
Preview Panel
The Preview panel, while not one of our three design steps, is a huge help while building your report. This panel provides quick visual feedback on your report. Not only does it provide you an instant example of what your report looks like, but it also gives you the ability to view the actual data (on the right) that is being sent to your report! Having a snapshot of your data can be incredibly helpful when trying to figure out why your report doesn't appear as you expect it to. Whether you have an error in your query, or a bad Data Key in a component, you'll be able to figure out the structure of the data your report is getting and quickly find ways to solve any problems.
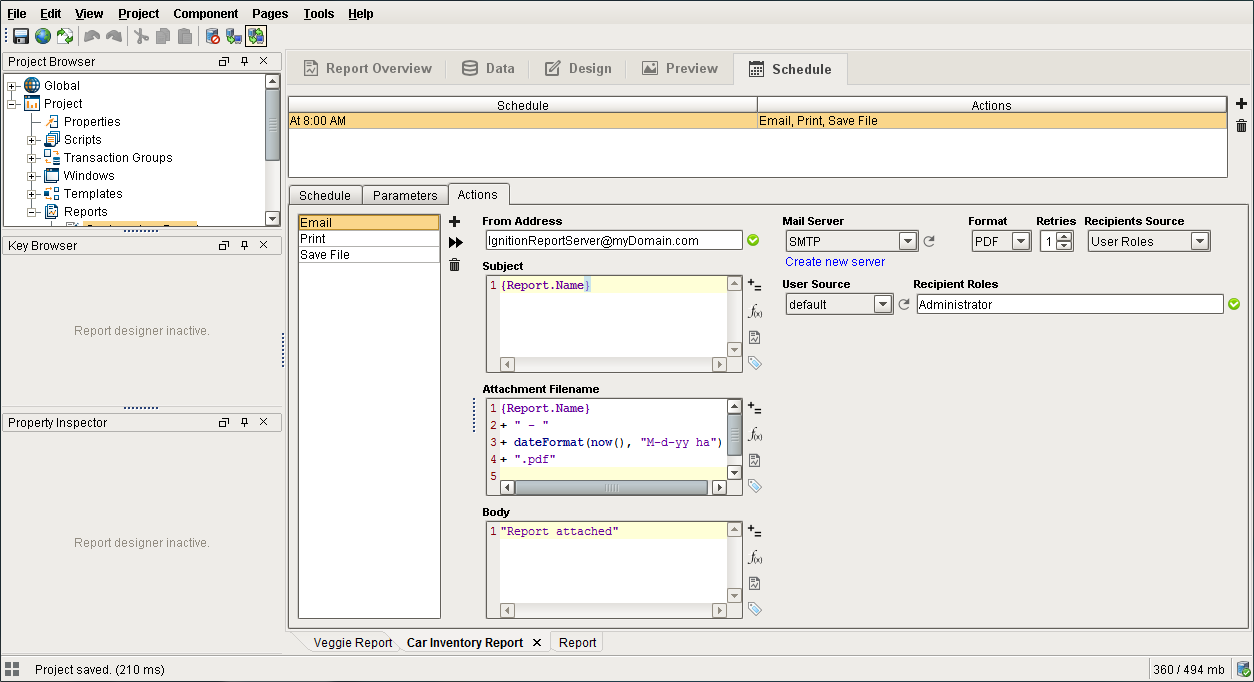
Schedule Panel
Scheduling a report to run is built-in and easy to use. The Schedule panel is an incredibly powerful way to automate the execution and delivery of your reports. Whether you have extremely long running queries that you don't want tying up a window, need to deliver to multiple file servers via FTP, or want to simply email to an existing roster, this panel provides you the means to do it. It's broken up into two major areas. On top, you find a simple table of schedules that have been established. To add a schedule, click the (![]() ) icon. With a schedule added, you can now choose when and how that scheduled Action will occur. Our schedules use the common Chron format, but don't worry if you aren't familiar with it. The preset options and combo-box configurability allow you to easily create just about any schedule you can imagine.
) icon. With a schedule added, you can now choose when and how that scheduled Action will occur. Our schedules use the common Chron format, but don't worry if you aren't familiar with it. The preset options and combo-box configurability allow you to easily create just about any schedule you can imagine.
Once you selected your schedule, you can add parameters that may affect your Actions. Actions are incredibly powerful and allow you to choose how you want to distribute or act on your finished reports. Whether saving a file locally, posting to an FTP server, or emailing, you can get your report where it needs to be automatically. If our normal distribution Actions somehow fall short, you can choose to act on the finished report by triggering a script! We've also given you a convenient way of immediately executing the Action.