Database Query Browser
The Database Query Browser Panel
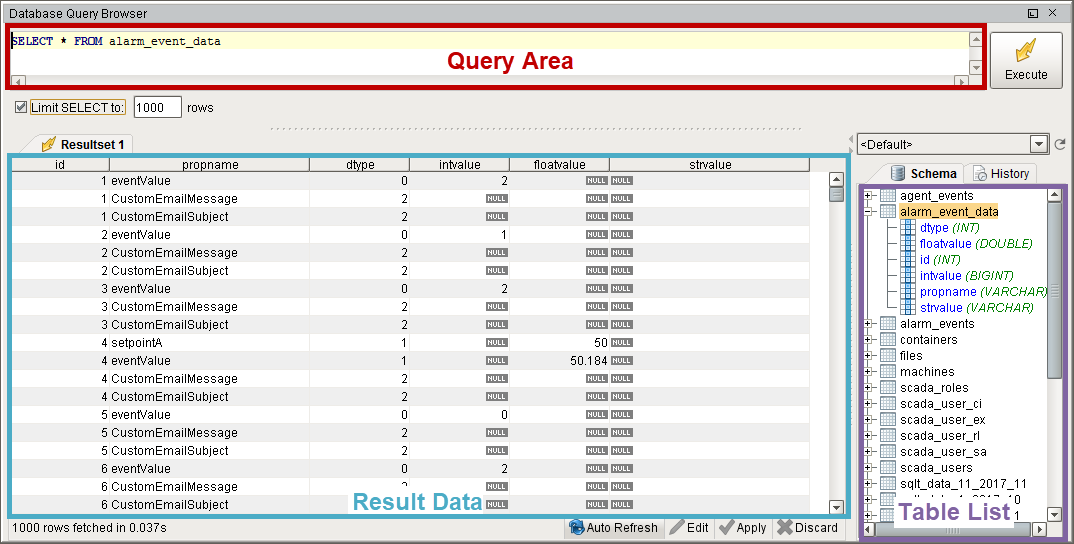
The Database Query Browser is a very convenient tool that lets you query any database connected to Ignition, and interact with tables. Because Ignition is so heavily integrated with databases, it is very common in the course of project design the need to inspect the database directly, or to experiment with a SQL query to get it just right.
The Database Query Browser is found in the tools menu and has a three basic parts to it. The Query Area is where a query can be written and then executed against the selected database connection. This can accept any type of query, but if the query would update the database, the Designer needs to have its Gateway Communication Mode set to read/write first. The database connection that the query is executed against can be chosen from the dropdown, below the Execute button. The Result Data space is where the results of the executed query will appear. If a SELECT query was run, then the table data will be shown. If an UPDATE, INSERT, or DELETE query was run, then the number of rows affected will be displayed instead. Finally, the Table List will display all of the tables in the specified database connection. The tables can be expanded to show the columns and their data types for that table. This can help when writing queries in the Query Area. Additionally, when a table is double clicked, the Query Area will automatically be populated with a SELECT * FROM the table.
Features of the Query Browser
The Database Query Browser has a few features that can help manage and build any SQL query.
Multiple Resultsets
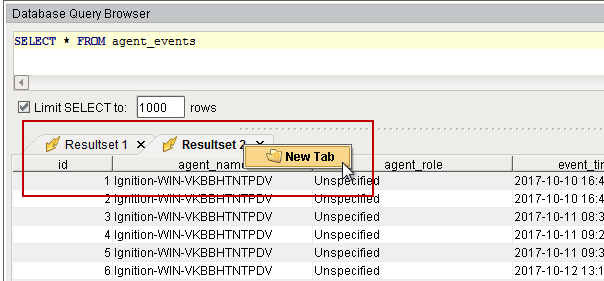
The Query Browser allows you to make multiple tabs of results, so that multiple queries can be run and their results compared to each other. Simply right click on the Resultset area and select New Tab. Your queries will be saved for each tab.
Query History
At the top of the Table List, there is a second tab labeled History. This will switch the Table List to instead show the history of queries run in the query browser. Double clicking one of the entries will push the query into the Query Area (for the selected tab). This allows you see what queries have been run previously to help you tweak your current query.

Select Limit
By default, any SELECT statement is limited to 1000 rows. This is to help the queries return quickly, however, it may not always be wanted. This can be turned off or adjusted by either clicking the checkbox or manipulating the row number located underneath the Query Area on the left. It is recommended to leave this on unless you know the result set size. It's better to use a count query than to return all results to see the result count. IE: SELECT COUNT(*) FROM table...

Auto Refresh
The Query Browser also lets you monitor a database table for changes by using the Auto Refresh button. This is often convenient when designing Transaction Groups. As the group runs, you can view the table that it is targeting with Auto Refresh turned ON to watch how the group is altering the table. Simply click the Auto Refresh button at the bottom of the Query Browser to periodically rerun the query in the Query Area. Make sure to include an ORDER BY clause so your results show up in the order you want.
![]()
Editing the Table in the GUI
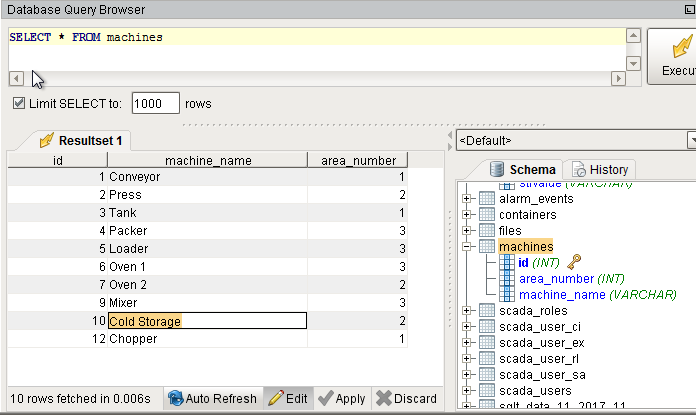
In addition to editing the table data using INSERT, UPDATE, and DELETE statements, the data can also be edited within the Result Data. Simply click the Edit button at the bottom of the Query Browser window.
![]()
Editing in this way requires that the data be obtained from a single table with a simple query. The table must also not be tied to other tables.
Once the Edit button is clicked, the values in the table can be edited by double clicking on the value and entering a new one.
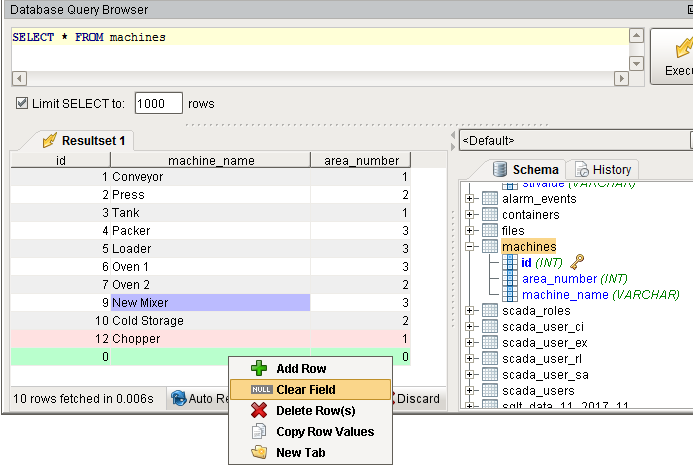
Right clicking on a row also provides a few options:
- Add Row: Will add a new row to the table for data to be entered into.
- Clear Field: Will clear out the value in the selected cell so that it will be NULL. This is different than simply deleting the value out and leaving it empty.
- Delete Row(s): Will delete the selected row or rows from the table.
- Copy Row Values: Will copy the row values in a comma separated form to the clipboard.
- New Tab: Will Create a new Resultset tab for a new query to be run in.
When editing values, cells will highlight depending on what is being done to them. Green cells are new, and typically indicate a new row was added. Red cells are marked for deletion, and will be deleted when the changes are confirmed. Blue cells are cells that have had values changed during editing.
After making edits to the table data, the changes then either need to be applied or discarded. This gives you the opportunity to revert the table to the way it was before the current edit session, or apply the changes and rewrite the table appropriately. Simply click the corresponding button at the bottom of the Query Browser next to the Edit button. Make sure your Gateway Communication Mode is set to Read/Write before Applying your changes.
