Alarm Status
Alarm Status Table
Once alarms have been configured, most users will want to view the status of alarms from within a client. Fortunately, alarms can be visualized in several ways.
By far the most popular way to visualize alarm status is with the Alarm Status Table component. This component immediately displays the status of all alarms in the system from all Tag providers. However the component can also filter down to specific alarm criteria. For example, the component can filter by source path which means a single Tag provider, folder in a Tag path, or even UDT instances can be focused on by the component.
The default look of the component is designed to make active alarms easy to spot, but the pallet can be customize to fit your company standard.
Display Path Versus Source Path
When displaying alarms on the Alarm Status Table component, it is common to filter on either the Display Path, or the Source Path.
The Display Path can be customized on each alarm. The default value for an alarm's Display Path is a Tag path that leads to the name of the alarm. The Integer Tag example above has an alarm named 'Alarm', and is located on a Tag path of 'Alarming Example/Integer Tag', thus the Display path will resolve to 'Alarming Example/Integer Tag/Alarm'. However, the Display Path can be customized when configuring the alarm. This is generally utilized to display readable messages as to what the issue is: i.e., "Tank 105 High Temp Alarm".
The Source Path is also a path to the alarm, but also notes the Tag provider the alarm is located in. Again using the Tag above, if the name of the Tag provider is 'default', then the source path would resolve to 'prov:default:/Tag:Alarming example/Integer Tag:/alm:Alarm'. Unlike the Display Path, the Source Path on an alarm can never be overridden.
Understanding the functionality of Display Paths and Source Paths allows for much flexibility when filtering alarms by Tag path.
Display the Status of a Single Alarm
Each Tag has several Tag properties that track the status of all their alarms. These properties can be used in Property Bindings to visualize the state of alarms on a specific Tag.
Example
-
In the Designer, create a new Label component on an empty window.
-
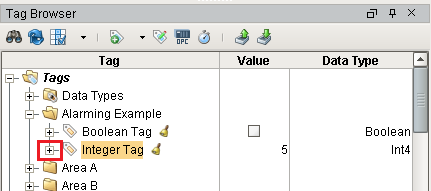
Create a memory Tag. In this example, we named the Tag "Integer Tag" and set the datatype to Integer. The alarm is configured to become active on a value of 1.
-
Once the Tag has been created, click on the '+' icon next to the Tag in the Tag browser.

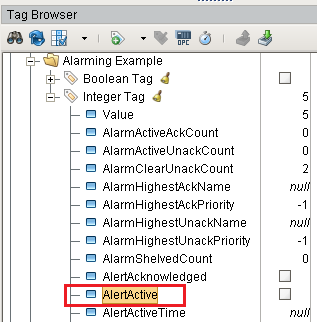
This will expand the Tag and show all of the Tag properties, including the AlertActive property.

-
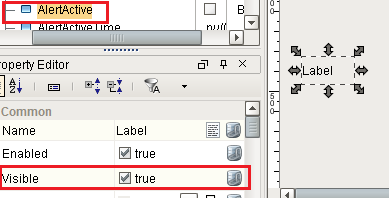
With the Label component selected, drag and drop the AlertActive property from the Tag to the Visible property on the Text Field component. This will create a binding directly to that Tag property.

-
You'll find that the component will appear when an alarm is active, and become hidden once all alarms on the Tag are cleared.
Alarm Status Tags
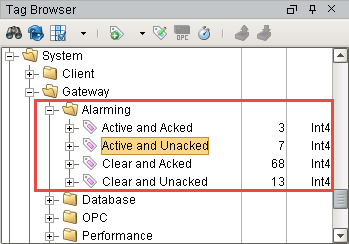
Ignition provides a set of System Tags to view information about the Ignition server which includes four Tags that count the number of alarms in each state. A quick way to see if any alarms are currently active and get an alarm count is to add a label on the Navigation window. The four system alarm states are:
- Active and Unacknowledged
- Active and Acknowledged
- Clear and Acknowledged
- Clear and Unacknowledged
In the Tag Browser of the Designer (default position in middle-left side of the Designer), scroll down to the System > Gateway > Alarming folder. You can see all 4 of the system Tags that Ignition provides. You can also see how many alarms are currently Active and Acked, Active and Unacked, Clear and Acked, and Clear and Unacked.

These system Tags can easily be used to visualize all alarms in the system.
