Styling Rows Based on Values
This page includes examples detailing different ways to style rows based on values using Script Transforms. Each example accomplishes similiar results through different binding and data types to change the background color of a row or individual cell.
Example 1: Styling Rows - Python Array/List
If the data property on the Table component has a Property binding configured to the view.custom.data property, we can add a Script Transform to specify a style condition for an entire row. The following example demonstrates this by changing the background color of rows that meet the value requirement to red.
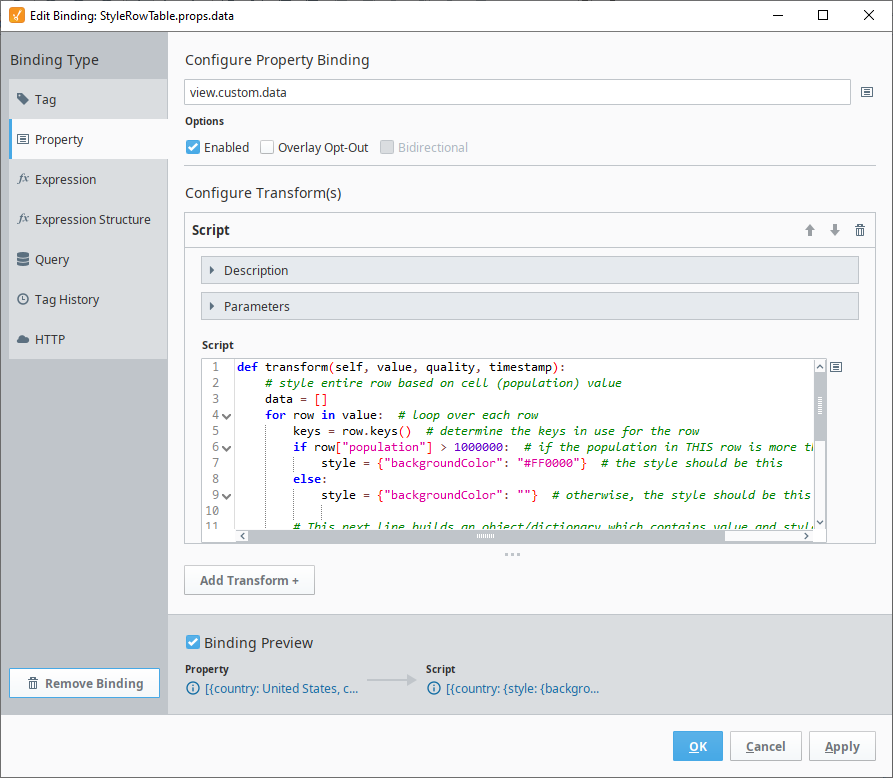
The following code was used in this example to add the styling changes:
def transform(self, value, quality, timestamp):
	data = []
	for row in value:  # Loop over each row.
		keys = row.keys()  # Determine the keys in use for the row.
		if row["population"] > 1000000:  # If the population in THIS row is more than 1000000...
			style = {"backgroundColor": "#FF0000"}  # the style should be this.
		else:
			style = {"backgroundColor": ""}  # Otherwise, the style should be this.

		# This next line builds an object/dictionary which contains value and style keys for
		# every cell in the row. The value key will be used to store the true value of the
		# object, while the style key will be used to define the appearance of the CELL.
		# Since our goal is to style all cells in this row in the same manner, we are re-using
		# the same style value across all cells in this row.
		formatted_rows = [{"value": v, "style": style} for v in row.values()]

		# Here, we make a proper python dictionary out of the known keys
		# and our formatted cells.
		row_dict = dict(zip(keys, formatted_rows))
		data.append(row_dict)  # Now append this new dictionary to our new data array/list.
	return data  # Finally, return our newly formatted data.
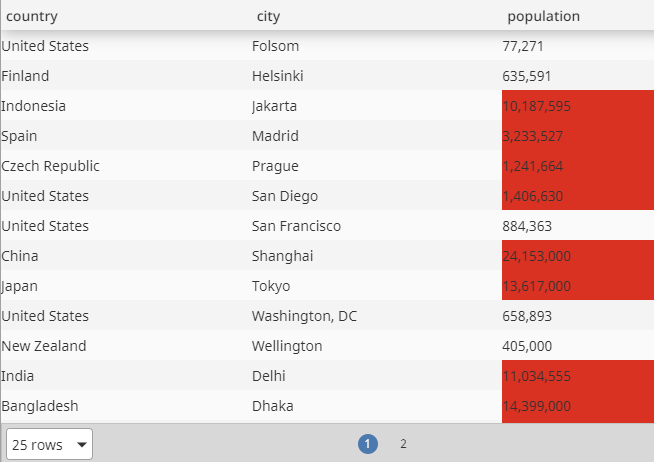
Clicking OK results in red backgrounds for entire rows where the Population column values are above 1,000,000.

Converting Datasets to an Array.
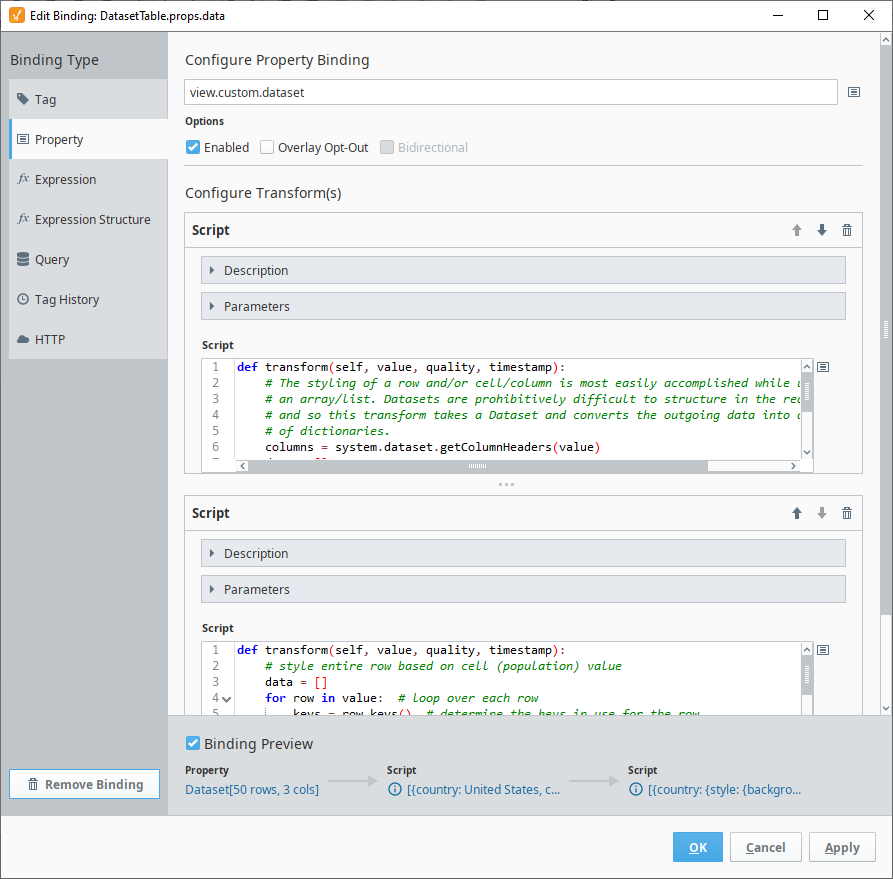
Styling a row or cell is best accomplished using an array/list. However, if your table values are provided through a dataset instead, you can configure your property binding to the custom.dataset property instead of the custom.data property. The following code is the second transform added to convert the dataset to an array/list before formatting the rows.
def transform(self, value, quality, timestamp):
	columns = system.dataset.getColumnHeaders(value)
	data = []
	for row in range(value.getRowCount()):
		row_obj = {}
		for column in range(value.getColumnCount()):
			row_obj[columns[column]] = value.getValueAt(row, column)
		data.append(row_obj)
	return data
Adding this Script Transform before the original Script Transform that styled the rows will result in the same row style results as the Table image above.
Example 2: Styling Singular Cells within Rows - Python Array/List
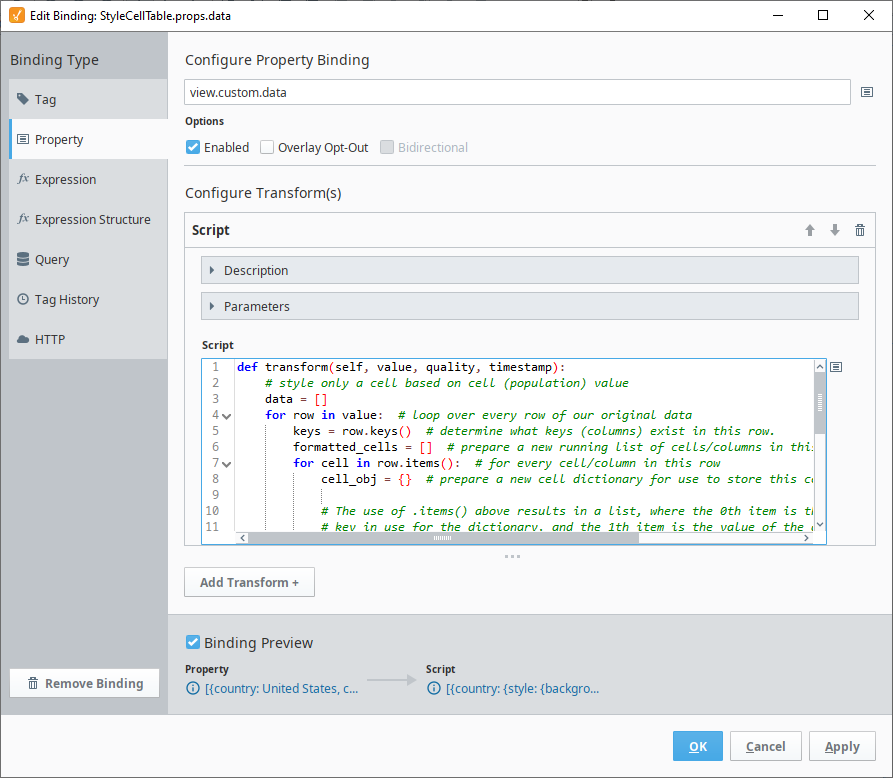
You can also style an individual cell instead of an entire row. For this example, we will still bind the data property on the Table component with a Property binding configured to the view.custom.data property, but the Script Transform will instead specify a style for individual cells in a row.
def transform(self, value, quality, timestamp):
	data = []
	for row in value:  # Loop over every row of our original data.
		keys = row.keys()  # Determine what keys (columns) exist in this row.
		formatted_cells = []  # Prepare a new running list of cells/columns in this row.
		for cell in row.items():  # For every cell/column in this row
			cell_obj = {}  # prepare a new cell dictionary for use to store this cell.

			# The use of .items() above results in a list, where the 0th item is the
			# key in use for the dictionary, and the 1th item is the value of the dictionary.
			# We need to see if the key in use for this cell/column is the key we are
			# basing our styling off of, and if so we need to see if the corresponding value
			# exceeds the threshold specified to use the style. Note here that the style is
			# specified for each individual cell/column.
			if cell[0] == "population" and cell[1] > 1000000:
				style = {"backgroundColor": "#FF0000"}
			else:
				style = {"backgroundColor": ""}

			cell_obj = {"value": cell[1], "style": style}  # Prepare a new cell dictionary.
			formatted_cells.append(cell_obj)  # Append our cell dictionary to the running list of cells for this row.
			row_obj = dict(zip(keys, formatted_cells))  # Make a proper dictionary out of our formatted cells.
		data.append(row_obj)  # Append our row to our new data array/list.
	return data  # Return our new data array/list.
Clicking OK will now show individually styled cells in the Population column based on values above 1,000,000.
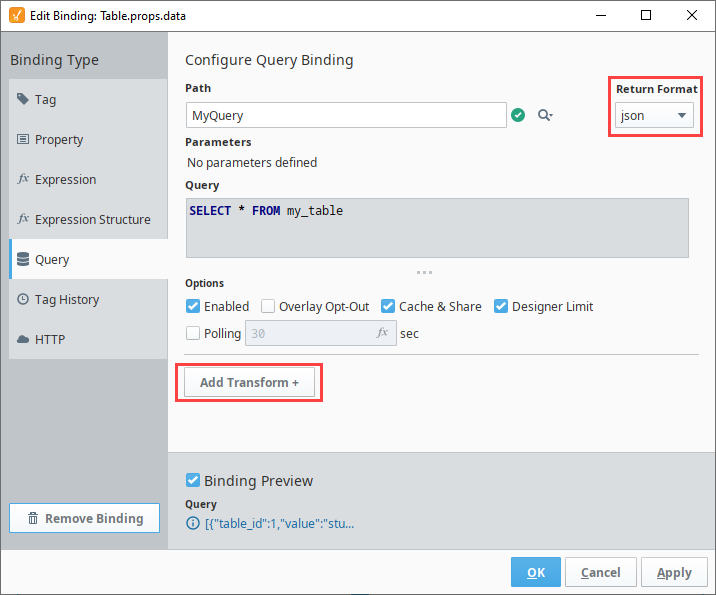
Example 3: Styling Rows - JSON Data
If the data property on the Table component has a Query binding configured, we can set the Return Format to JSON, and then add a Script Transform:
In the Script Transform, we can add code that adds a styling to each value in the Named Query results:
# Create a new list to store a modified result set from our query
newData = []

# Iterate over each row in 'value', which is the original result set
for row in value:

    # Within the row, iterate over each column
    for col in row:

        # Create a variable to store the contents of the original "cell"
        cell = row[col]

        # Create a dictionary containing the original value, and some styling information
        row[col] = {"value": cell, "style": {"backgroundColor": "#00FF00"}}

    # Add the modified row to the list we initialized earlier
    newData.append(row)

#Return the list
return newData
Example 4: Styling Rows - Dataset Data
You can also change the color of rows in a table when the source of data is a dataset. This approach involves recreating the original data as a new JSON document that contains a style object for each row.
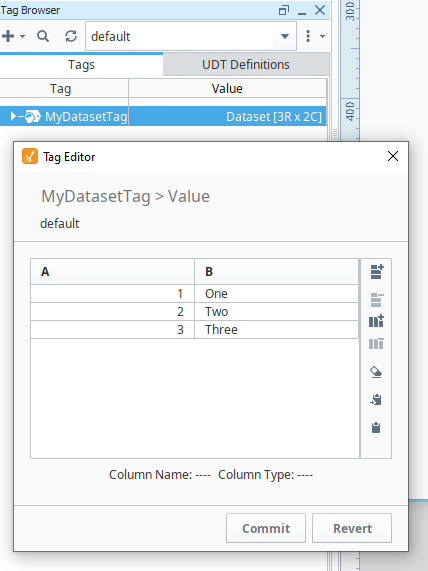
For example, say there's a memory tag set to a dataset type, which contains the following data:
| A | B |
|---|---|
| 1 | One |
| 2 | Two |
| 3 | Three |
{
  "valueSource": "memory",
  "dataType": "DataSet",
  "name": "MyDatasetTag",
  "value": "{\"columns\":[{\"name\":\"A\",\"type\":\"java.lang.Integer\"},{\"name\":\"B\",\"type\":\"java.lang.String\"}],\"rows\":[[1,\"One\"],[2,\"Two\"],[3,\"Three\"]]}",
  "tagType": "AtomicTag"
}
{
  "valueSource": "memory",
  "dataType": "DataSet",
  "name": "MyDatasetTag",
  "value": "{\"columns\":[{\"name\":\"A\",\"type\":\"java.lang.Integer\"},{\"name\":\"B\",\"type\":\"java.lang.String\"}],\"rows\":[[1,\"One\"],[2,\"Two\"],[3,\"Three\"]]}",
  "tagType": "AtomicTag"
}
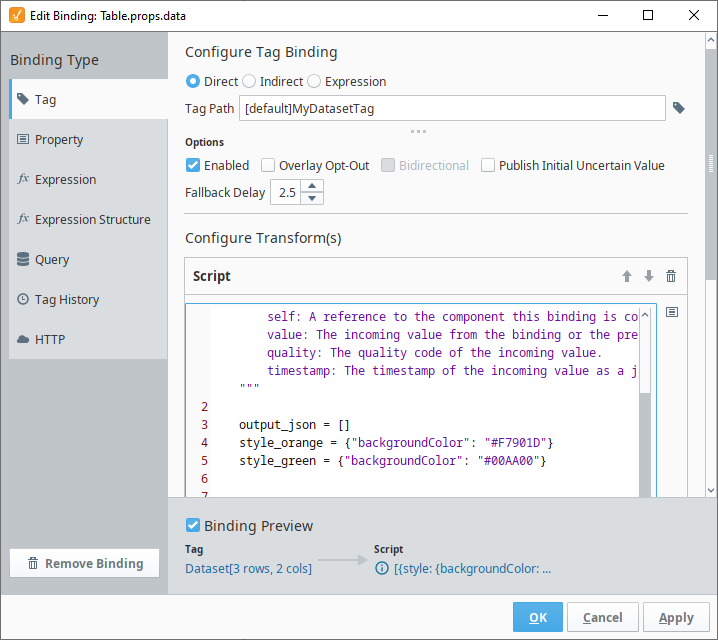
We can bind the table component's props.data property to this tag with a Tag binding. From here we can add a Script Transform with the following:
# This list will be used to create a JSON like structure that will insert rows for our styles
output_json = []

# Here we can define what styling on our rows will be.
style_orange = {"backgroundColor": "#F7901D"}
style_green = {"backgroundColor": "#00AA00"}

# You could change more than just the background color, for example:
# style_another_example {"backgroundColor": "#00AA00", "font-weight": "bold"}


for row in range(value.getRowCount()):
    row_object = {}
    row_value = {}
    row_style = {}
    for col in range(value.getColumnCount()):
        row_value[value.getColumnName(col)] = value.getValueAt(row, col)
        row_object['value'] = row_value

        # Here we're checking the name of the column that we want to base our styling on.
        if value.getColumnName(col) == 'B':

            # Here we're checking for individual values within the column, and applying styling
            if value.getValueAt(row, col) == 'One':
                row_style = style_orange
            elif value.getValueAt(row, col) == 'Two':
                row_style = style_green

        row_object['style'] = row_style
    output_json.append(row_object)
return output_json
This would result in coloring rows where the column B has distinct values of One or Two.
