Displaying a Subview in a Table Row
In a Perspective Table component, you have the option to enable subviews. When a subview is set up, you can click on the Expand icon and have another view display without closing the first view. This example sets up a table with several city statistics and when the Expand icon is selected for a city, a Map component will be displayed showing the location of the city on the map.
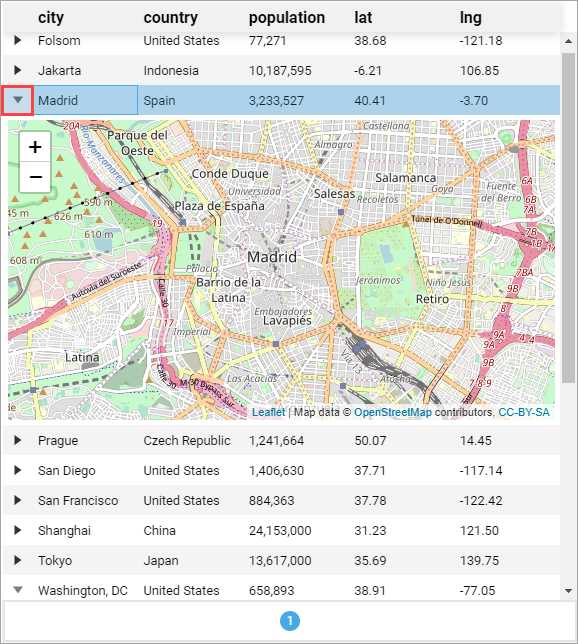
This example focuses on using a Map component in a subview on the table, but the larger implication here is that subviews in table rows can receive values from each row and utilize them with property bindings, allowing each subview to contain data unique to the row. The image below shows what our finished view will look like.

Summary of Subviews
When subviews are enabled for each row in a table, the row will implicitly pass some parameters over to the subview. The passed parameters are:
- row - a number representing the row
- rowIndex - a number reepresenting the index of the current row
- value - JSON Object representing the contents of the row. The value of each column in the row will be a value under this object.
Thus, in the image above where our table has a country column, the subview will receive the value of country at params.value.country. So you can create a component binding on the subview's configuration that references a value at params.value.country.
Create a View for the Table Data
We'll start by creating a view that will contain the table.
-
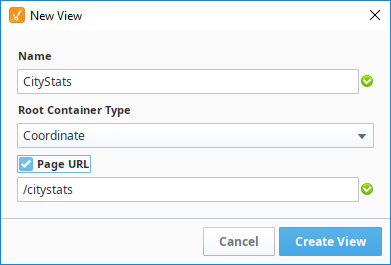
Right click on Views to create a view. In the example, we named the new view CityStats, set it as a Coordinate root container Type, and checked the Page URL option. Pages can be added later as well.
-
Drag a Table component onto the view.
-
The table needs to have Latitude and Longitude data for the map to show that location. Highlight and copy the following data:
[
{
    "city": "Folsom",
    "country": "United States",
    "population": 77271,
    "lat": 38.678287,
    "lng": -121.177318
},
{
    "city": "Jakarta",
    "country": "Indonesia",
    "population": 10187595,
    "lat": -6.208404,
    "lng": 106.849087
},
{
    "city": "Madrid",
    "country": "Spain",
    "population": 3233527,
    "lat": 40.41498,
    "lng": -3.702002
},
{
    "city": "Prague",
    "country": "Czech Republic",
    "population": 1241664,
    "lat": 50.073453,
    "lng": 14.450091
},
{
    "city": "San Diego",
    "country": "United States",
    "population": 1406630,
    "lat": 32.713832,
    "lng": -117.158616
},
{
    "city": "San Francisco",
    "country": "United States",
    "population": 884363,
    "lat": 37.776379,
    "lng": -122.423501
},
{
    "city": "Shanghai",
    "country": "China",
    "population": 24153000,
    "lat": 31.227167,
    "lng": 121.498839
},
{
    "city": "Tokyo",
    "country": "Japan",
    "population": 13617000,
    "lat": 35.69042,
    "lng": 139.746457
},
{
    "city": "Washington, DC",
    "country": "United States",
    "population": 658893,
    "lat": 38.90598,
    "lng": -77.04882
},
{
    "city": "Wellington",
    "country": "New Zealand",
    "population": 405000,
    "lat": -41.284336,
    "lng": 174.770488
}
] -
Right click on the data property of the Table component and select Paste.

-
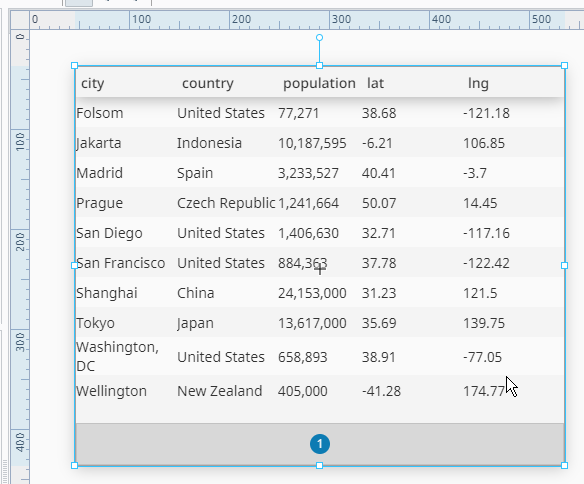
Your table will now display the data for 10 rows and 5 columns.
-
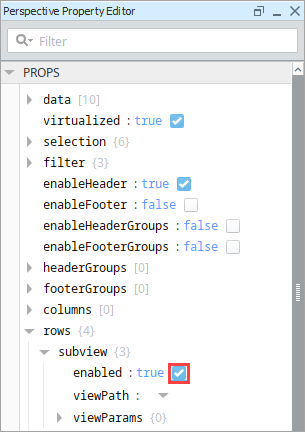
Next, enable the subview property under props.rows.
-
The table now has Expand
 icons for each row.
Create a View for Displaying the Map
Next we'll make the view that will be display a map of the cities in our table.
-
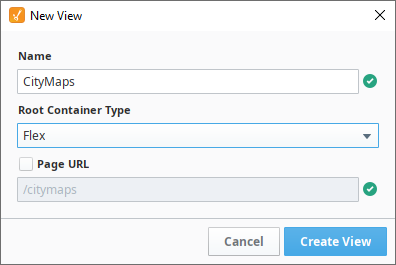
In the Project Browser, right click on Views to create a view. Name the new view CityMaps. Set it as a Flex layout, so the map easily takes up all available space. Lastly, do not check the Page URL option, as we don't need a corresponding page.
-
Drag a Map component onto the CityMaps View.
-
Set the Map's position.grow property to 1 so it resizes to take up the entire view.
-
Click on the CityMaps view in the Project Browser. In the Property Editor, click the
 Add View Parameter link under Params and choose Object.
 -
Double click on key, and enter value as the object name. Note that the object must be named "value".
-
Next, we'll add two parameters to that value object.
-
Click
Add View Parameter link under Params and choose Value.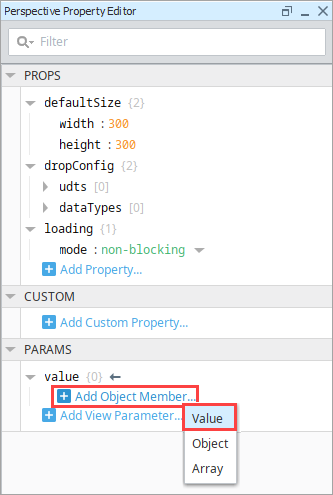
-
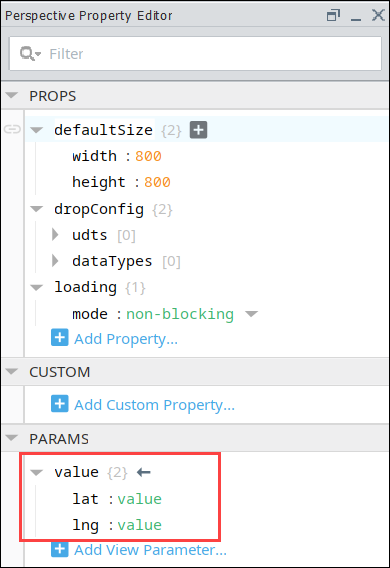
Double click on key, and enter "lat". This matches the lat (latitude) column from the Table on the CityStats view. This name must exactly match the column name in the table.
-
Click the
Add Object Member icon next to value and choose Value. -
Double click on key, and enter "lng". This matches the lng (longitude) column from the Table on the CityStats view. This name must exactly match the column name in the table.
 note
noteIt's important that the object here is named "value". The perspective table we're going to embed the map into has a feature where content from each row in the table can be passed to its subview. This mechanism requires that the subview contain an object named "value". If you want the subview to be passed any of the values from its parent row, simply make a "value" object, and add values to it where the keys match the name of the column on the table.
-
-
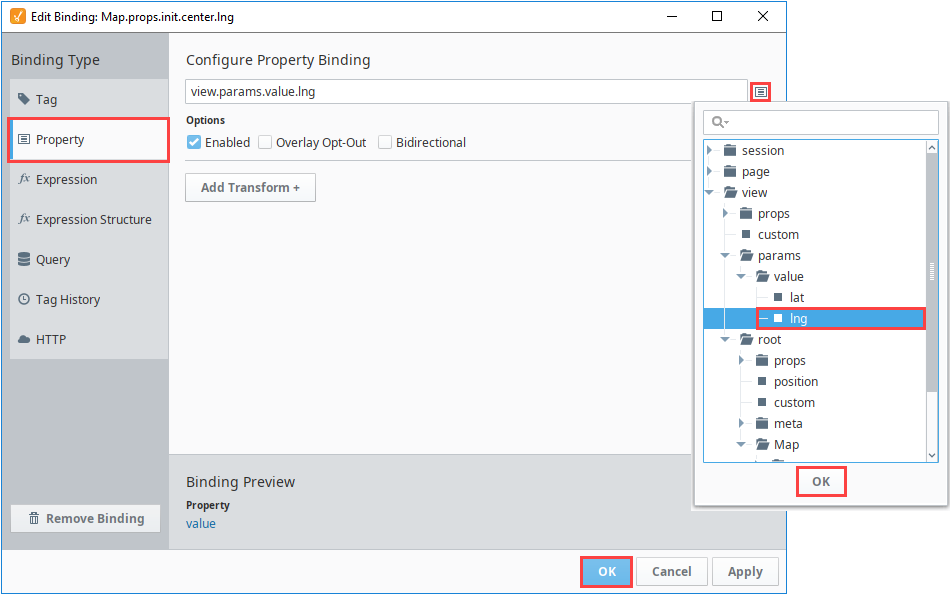
Next select the Map component. We need to set the map's initial geographic center to the view parameters. In the Property Editor, expand the init.center property.
- Click on the Binding
 icon next to the lat property.
 - On the Edit Binding screen, select Property as the binding type.
- Click the Browse Properties
 icon. Navigate to view, the params, the value, and then the lat property.
 - Click OK, then click OK again to save the binding.
noteAt this point, the init.center.lat property is bound to view.params.value.lat where view.params.value.lat's value is "value" instead of a valid latitude number. This will cause a Component Error which is expected.
- Click on the Binding
Use the Maps View as a Subview for the Table
Lastly, we need to tell the CityStats View to use CityMaps as its subview.
-
On the CityStats View, select the Table component.
-
In the Property Editor, scroll down to the rows.subview.enabled property.
-
Next, enable the enabled property.
As a result, you'll notice the table now has Expand
icons for each row. -
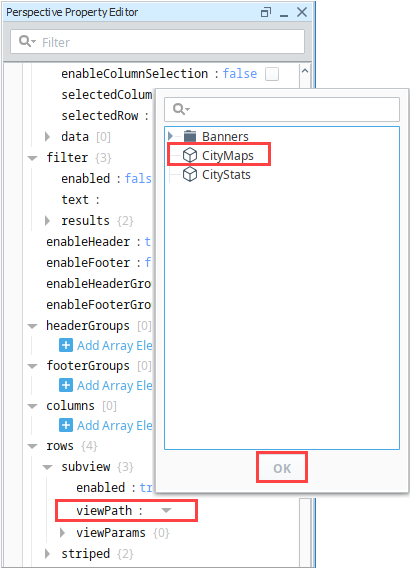
Find rows.subview.viewPath, and click the dropdown to see the a list of possible views. Choose CityMaps from the list and click OK.
-
Save your project.
-
Put the Designer into Preview mode. Click on the Expand
icon next to one of the cities. You'll see a map of the city appear underneath the table row for that city. To close the map, click the Collapse  icon.
icon.