Indirect Easy Chart
Configuring an Indirect Easy Chart
To learn more, go to the Tag and Configuring Tag History pages. The examples below use OPC PC Tags from the Programmable Device Simulator driver, but Memory Tags can be used instead.
It is possible for the Easy Chart component to be indirect and point to a set of Historical Tags based on any parameter using the Cell Update Binding type. In this example, suppose you have a small tank farm consisting of Tank 100 through Tank 105. Every tank is identical and uses the same Tags. Each tank has a Level and Temperature Tag which are set to log to the Historian.
Using an Indirect Easy Chart is a good way to see the history of these Tags for each tank in the tank farm. A convenient way to set this up is using a Dropdown List component where an operator can select various tanks to see a Tank's Tag history. This example will show you how to configure a cell update binding on an Easy Chart to be indirect and point to a set of Historical Tags.
-
In the Designer, drag a Tag Browser Tree and an Easy Chart component into your workspace.
-
Put the Designer in Preview Mode
 .
. -
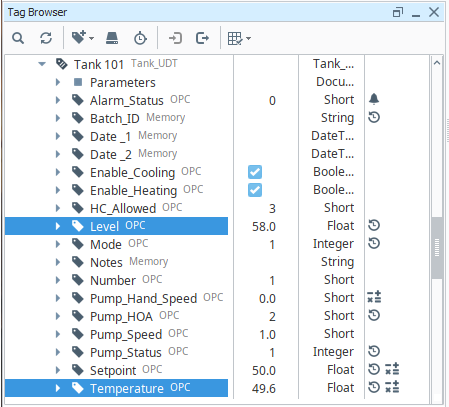
Navigate to the Tank Tags in the Tag Browser Tree. Under Tank 101, drag the 'Level' and 'Temperature' Tags from the Tag Browse tree onto the Easy Chart.
-
Put the Designer back in Design Mode
 .
. -
Drag a Dropdown component to your workspace. Using a Dropdown list will make it convenient for the operator to select a Tank and see the history of the Level and Temperature Tags for that tank.
-
With the Dropdown component selected, click on the Dataset Viewer
 icon to the right of the Data property in the Property Editor.
 -
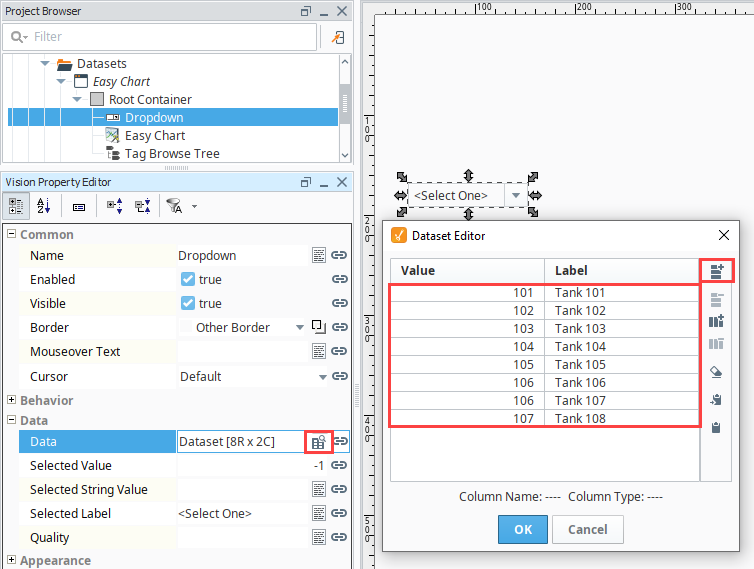
Click the Add Row
 icon for as many Tanks that you have in your Tank Farm. Then enter the Value and Label for each of the Tanks.
 -
Click OK.
-
Put the Designer in Preview Mode
. -
Click the Dropdown list to see the complete list of Tanks in your Tank Farm that you just entered.

-
Put the Designer back in Design Mode
. -
Right click on your Easy Chart and choose to Customizers > Easy Chart Customizer.
You'll notice that the Tag Paths are pointing directly to Tank 101. The only difference between Tank 101 and all the Tanks in the Tank Farm is the Tank number (i.e., 101, 102, 103, etc.). You can manually point to a different Tag Path by replacing ‘101’ in the Tag Path with a different Tank number such as ‘102,’ but we'd rather have the Tag Paths change dynamically when the user selects a Tank. Press OK.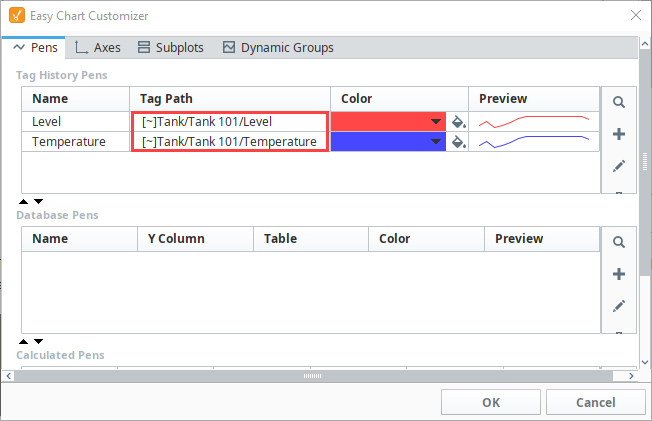
-
The Easy Chart component has a property called Tag Pens which stores all the configuration information that you have configured in the Easy Chart about your pens. With the Easy Chart selected, click on the Dataset
icon in the Property Editor to view all the information for your Tag Pens.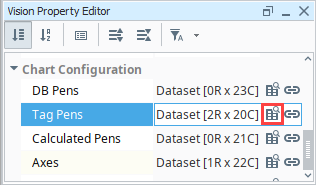
-
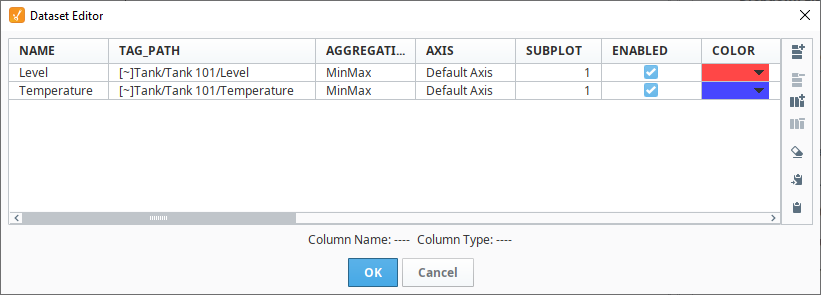
The dataset is displayed. It contains one row for each Tag. The second column is the Tag Path that you will want to change dynamically. Press OK to close the Dataset Viewer.
-
Next we'll use a Cell Update Binding in order to change an individual cell of a dataset. With a Cell Update Binding, you can select one or more cells and dynamically bind them to a property or to a Tag that you have in your system. Click on the Binding
 icon next to Tag Pens property to open the Property Binding window.
 -
Select the Cell Update binding type.
-
Select Tag Path cell for Level, and click the Add
 icon under the Cell Bindings table.
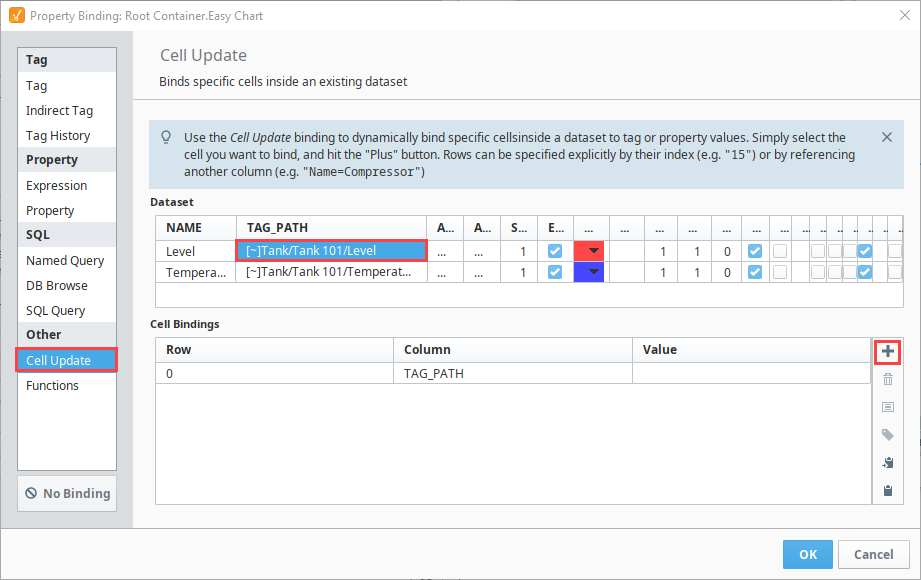
-
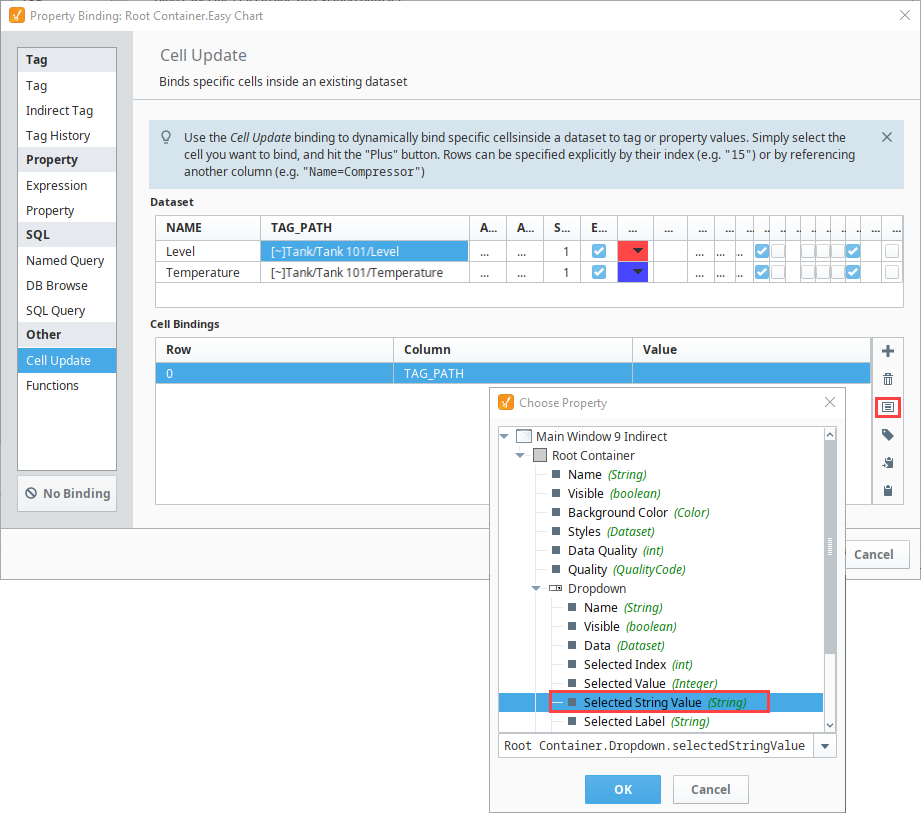
Select the first row you just added in the Cell Bindings Table, and click the Insert Property Value icon.
-
From the Property Window under the Dropdown folder, click the Selected String Value. This will grab the Tank number the operator selected from the dropdown list.
-
Click OK. Ignition fills in the Cell Binding value.
-
Repeat steps 17 through 20 for the Temperature Tag Path.
-
Next, expand the Value fields to make the Tag Path dynamic. Update the fields as follows.
Cell Binding to make Tag Path Dynamic[~]Tank/{Root Container.Dropdown.selectedStringValue}/Temperature
[~]Tank/{Root Container.Dropdown.selectedStringValue}/Level -
Click OK to save the bindings.
-
Now you have an Indirect Easy Chart. To test it, put the Designer in Preview Mode
. -
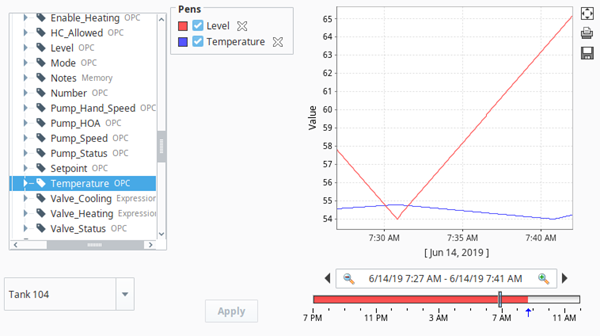
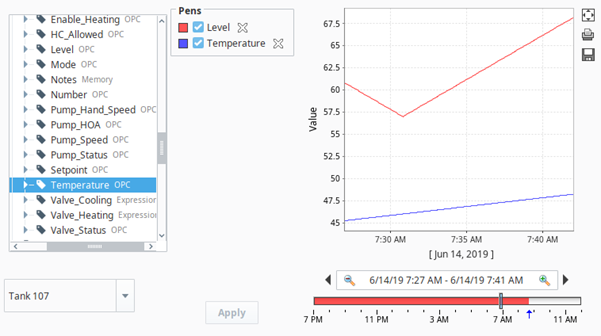
Select a Tank from the Dropdown List. The Level and Temperature values will change in the chart. Next select a different Tank from your Dropdown List to see how the history changes on the Easy Chart.