Easy Chart - Database Pens
Database Pens
Database Pens are driven by a SQL query, so they are ideal to use when trending Transaction Group data. However, they can query for data in any connected SQL database, so it is possible to show historical data recorded by other systems on the Easy Chart.
To learn more, go to the Tag and Configuring Tag History pages. The examples below use OPC PC Tags from the Programmable Device Simulator driver, but Memory Tags can be used instead.
Configuring Database Pens
In this example, we'll configure a database pen driven by a SQL query to show historical data and display it on the Easy Chart.
-
Drag an Easy Chart component onto your Vision window.
-
Right click on the Easy Chart component and choose Customizers > Easy Chart Customizer.
-
In the Database Pens section, we'll create a database pen to trend data stored in our database. Click the Add
 icon to create the Database Pen.
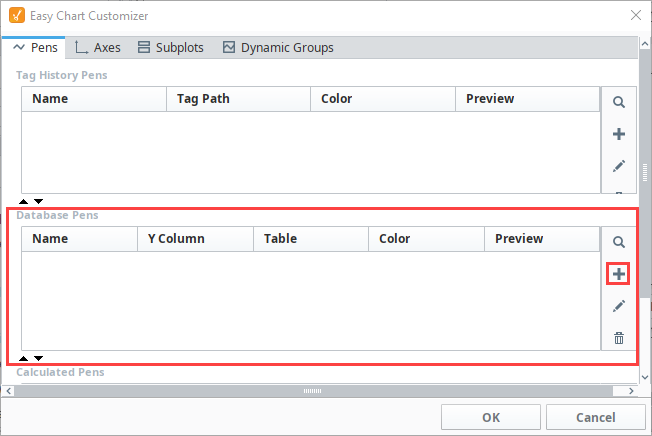
-
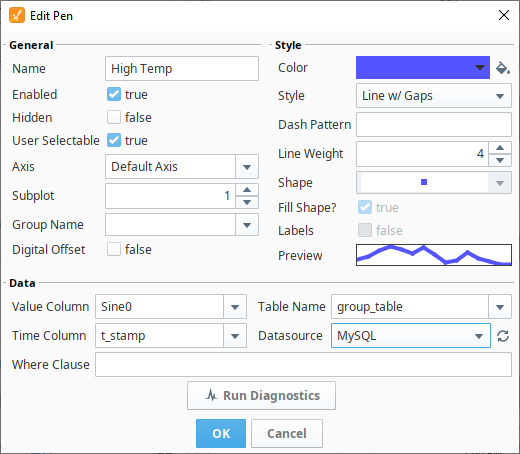
The Edit Pen window will open. Here is where you enter your database pen data. In the very least, we'll need values for the following properties:
We entered the following settings:- Name - The name of the pen on the chart. Works the same as the name on any other pen.
- Datasource - The name of the database connection (as configured on the gateway) that contains the table we want to extract values from.
- Table Name - The name of the database table that contains the values that we want to represent on the chart.This dropdown will automatically populate with available table names once the Datasource property has a valid database selected.
- Value Column - The name of the column in the database table that contains the values we want to show, representing the value of the datapoint at a particular time. This column is ultimately responsible for the determining where each point lies on the chart's Y-axis. This dropdown will automatically populate with column names once a value for the Table Name property has been set.
- Time Column - The name of the column in the database table that contains a timestamp, representing the time of the datapoint. This column is ultimately responsible for determining where each point lies on the chart's X-axis. This dropdown will automatically populate with column names once a value for the Table Name property has been set.
- Axis - All pens require an axis. We can use the default here.
Click OK to save your database pen settings.
-
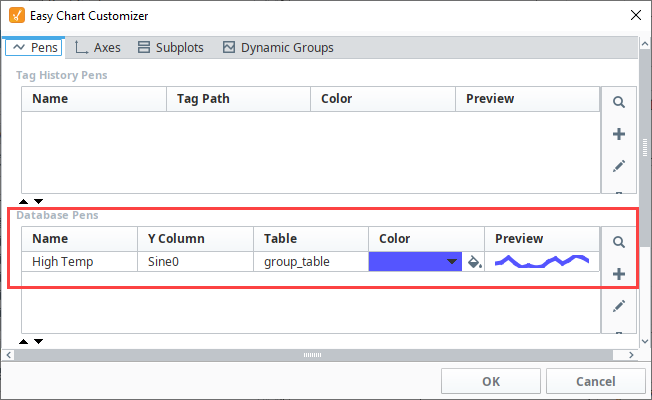
In the Database Pens area, you will see your database pen that you created. Click OK to exit the customizer and view your Easy Chart.
-
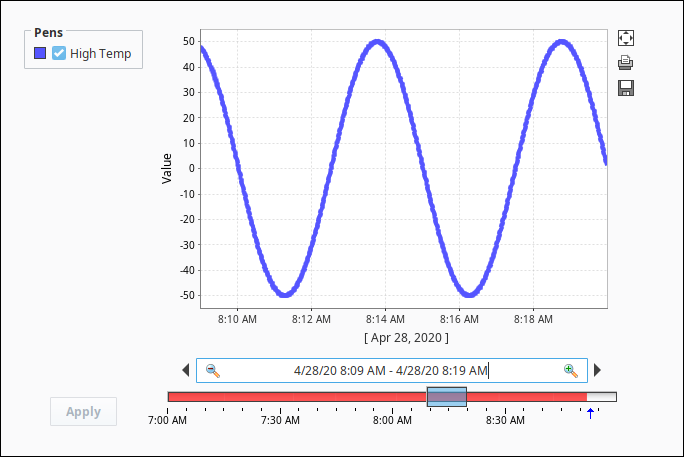
The High Temp database pen is now trending data for the High Temp values we want to show at a selected time.