Using the Tag Browse Tree for Charting
In the Designer, you can use a special built-in component called the Tag Browse Tree to create Ad Hoc Charts where you can pick and choose which pens you want to put on an Easy Chart. This same functionality is also available for an operator in the Runtime.
-
In the Designer, drag a Tag Browse Tree component and Easy Chart component from the component palette to your workspace.
-
Put the Designer in Preview Mode
 .
. -
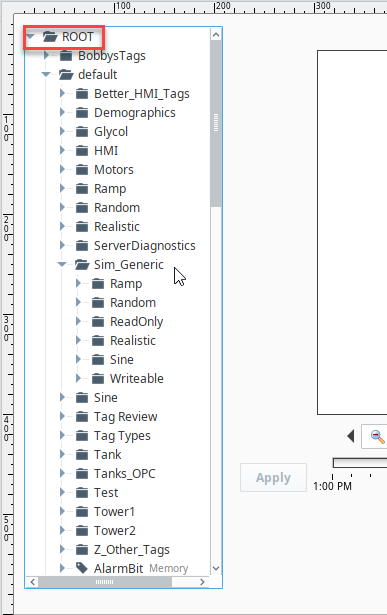
Expand the Tag folders to see the Tags in your system. By default, the Tag Browser Tree component shows you all Tags even those Tags that are not logged in Historian.
-
Put the Designer back in Design mode
 .
. -
Select the Tag Browse Tree component.
-
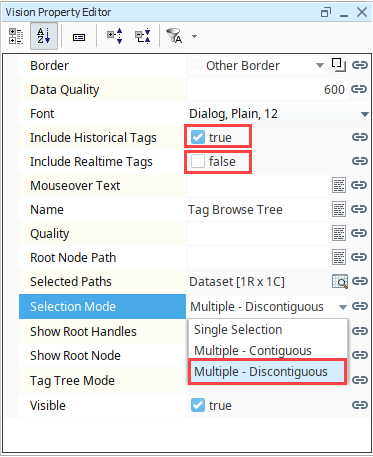
In the Property Editor, set the following properties:
- Set Include Realtime Tags to false.
- Set Include Historical Tags to true.
- Set the Selection Mode to Multiple - Discontiguous.
-
Save your project.
-
Launch a Vision Project or put the Designer in Preview Mode
. -
Drag some tags over onto the chart. We chose Sine0, Sine2, Sine4, and Sine6. Note that because we previously set selection mode to Multiple - Discontiguous, we can choose several Tags using Shift-Click. The Tags don't have to be contiguous within the Tag browser.

-
YYou can click the Delete
 icon to the right of any of the pens to remove a Tag from the chart. You can also remove all pens and go back to an empty chart, and pick and choose which of the Tags you want to drag on to the chart.
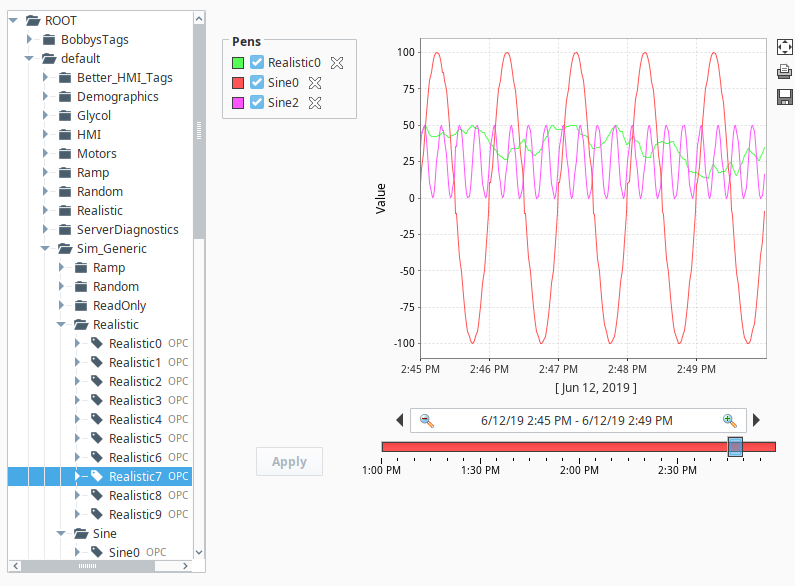
- When working in the Designer, whatever pens you have on your Easy Chart when you saved your project, the same pens will also be displayed on the chart when the client is opened.
- You may have multiple axes set up for your Easy Chart, but when dragging Tags from the Tag Browse Tree component to an Easy Chart, there is no way for the user to set which axis to use. Because of this limitation, any Tag that is added in this way will attempt to match their Engineering Units property to an axis on the chart. If no match is found, the default axis will be used.