Easy Chart - Digital Offset
Digital pens often share the same subplot on the Easy Chart component. When you have multiple digital pens on the same Easy Chart subplot, it's hard to see what the values are of each pen because they may overlap each other. There is a digital offset pen setting that can be set which prevents the values from overlapping and enables them to be seen better in the subplot.
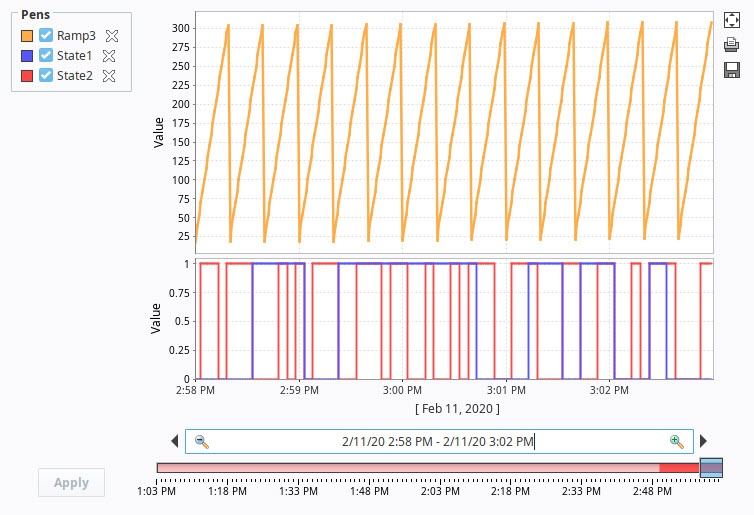
The following example shows two digital pens on the same subplot: State1 and State2. The values are a little difficult to see because they are on top of each other.

Adding a Digital Offset
In this example, we will apply a digital offset on the pen renderer so you can see the values better.
-
Right click on the Easy Chart component and choose Customizers > Easy Chart Customizer.
-
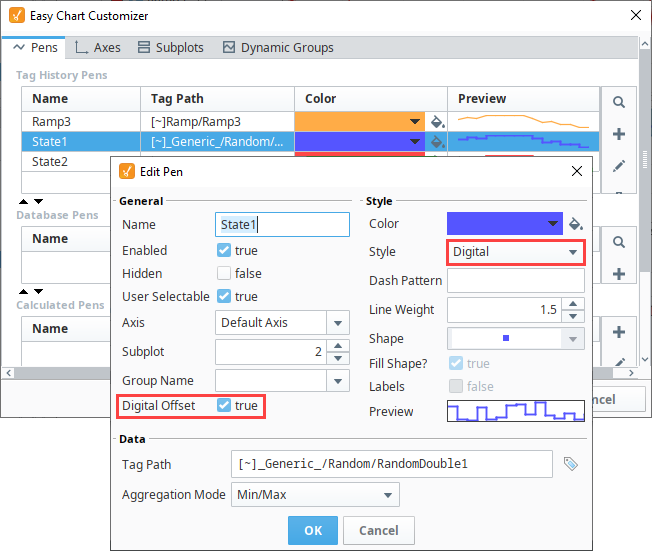
On the Pens tab, select the 'State 1' row pen, and click the Edit
icon.
-
Set the Style to 'Digital'.
-
Check the Digital Offset box to ‘true'. Click OK to save the changes to the pen.

-
Repeat steps 2-4 for the 'State 2' pen.
-
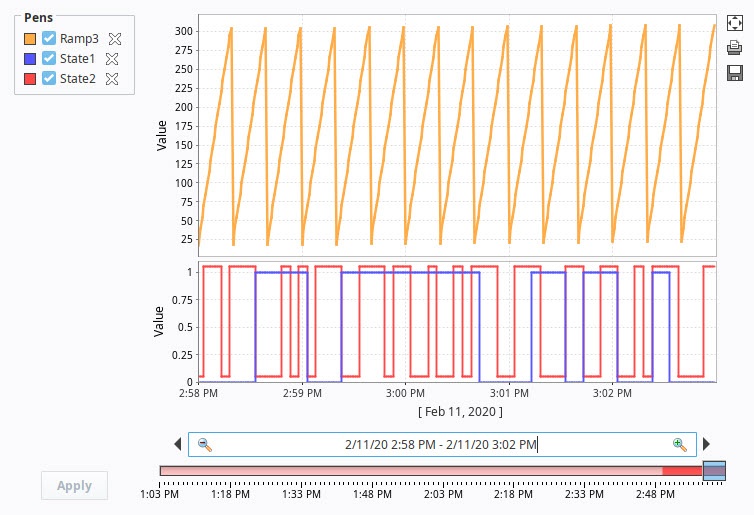
When you're finished editing your pens, click OK to return to the Easy Chart. You will see a little offset in the values between the State pens in the 2nd subplot so they don’t overlap each other, making it a lot easier for the operator to read the digital values.
