Easy Chart - Calculated Pens
To learn more, go to the Tag and Configuring Tag History pages. The examples below use OPC PC Tags from the Programmable Device Simulator driver, but Memory Tags can be used instead.
Calculated pens display a value that is dynamically calculated based on another pen. This can be used to calculate certain values for a pen and graph them alongside the original pen values, allowing you to gain valuable insight into your data. There are many unique calculations that can be used, with some of them containing unique customization. Almost all of the Calculated pens require a driving pen, which is a tag or database pen that you have already set up.
You cannot bind the Calculated Pen values inside the Easy Chart Customizer. To bind the function values, use the Cell Update Binding.
Calculated Pen Functions
There are a variety of functions that can be used to calculate the pen value. The pen functions are located on the Edit Pen screen in the Function dropdown list. The table below defines the available functions.
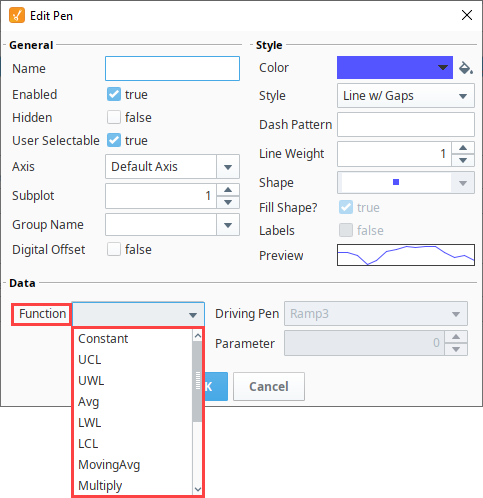
| Function | Display Name | Description | Extra Properties |
|---|---|---|---|
| Constant | Constant | A constant value on the chart. | Constant Value - The constant value of the pen. |
| Upper Control Limit | UCL | The upper control limit of the driving pen, which is three standard deviations above the mean of the Driving Pen | |
| Upper Warning Limit | UWL | The upper warning limit of the driving pen, which is two standard deviations above the mean of the Driving Pen | |
| Average | Avg | The average of the driving pen. | |
| Lower Warning Limit | LWL | The lower warning limit of the driving pen, which is two standard deviations below the mean of the Driving Pen | |
| Lower Control Limit | LCL | The lower control limit of the driving pen, which is three standard deviations below the mean of the Driving Pen | |
| Moving Average | MovingAvg | A series of averages based on subsets of the driving pen. The subsets are determined by the window size. | Window Size - The size of the moving average window, specified as a multiplier of the chart's date range. |
| Multiply Pen | Multiply | Multiply each data point of the driving pen by a factor. | Factor - The factor that each data point of the driving pen is multiplied by. |
| Minimum Value | Min | The minimum value of the driving pen. | |
| Maximum Value | Max | The maximum value of the driving pen. | |
| Running Sum | RunningSum | A running sum or running total of the driving pen. | |
| Sum | Sum | The sum of two different driving pens. | Secondary Pen - The second driving pen. |
| Difference | Difference | The difference of two separate driving pens. | Secondary Pen - The second driving pen. |
| Linear Regression | LinearRegression | Will create a linear regression line for the driving pen. |
Configuring Calculated Pens
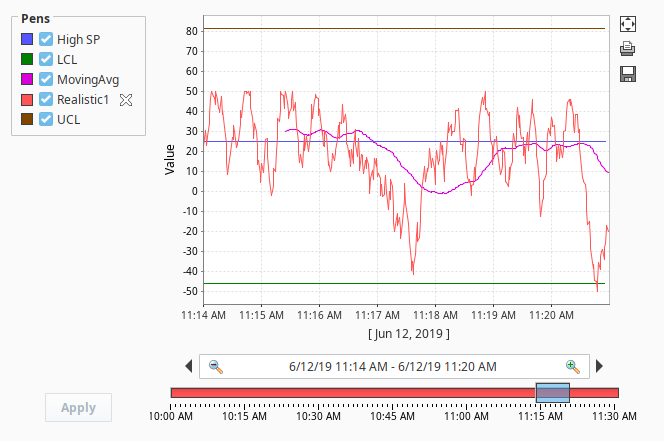
In this example, we will configure the following calculated pens on our Easy Chart: Constant, Moving Average, Upper Control Limit (UCL), and Lower Control Limit (LCL).
-
Drag an Easy Chart component onto your Designer window.
-
Drag a Tag onto the chart. In this example, we are using a 'Realistic1' tag from Programmable Device Simulator.
-
Right click on the Easy Chart component and choose Customizers > Easy Chart Customizer.
-
The Pens tab will open and you'll notice a Calculated Pens Table at the bottom of the screen. Click the Add
 icon.
icon.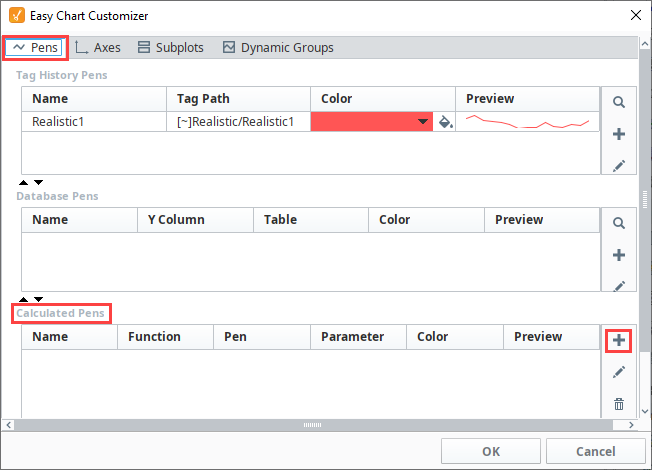 note
noteCalculated pens are just like other pens, so you can specify the style, color, axis and subplot in the Edit Pen window.
-
This will open the Edit Pen window. Set the calculated pen options as follows:
- Name: High SP
- Driving Pen: Realistic1 (Since we only have one tag on our Easy Chart, the Realistic1 tag is the default).
- Function field: Constant
- Constant Value: 25
-
Click OK.
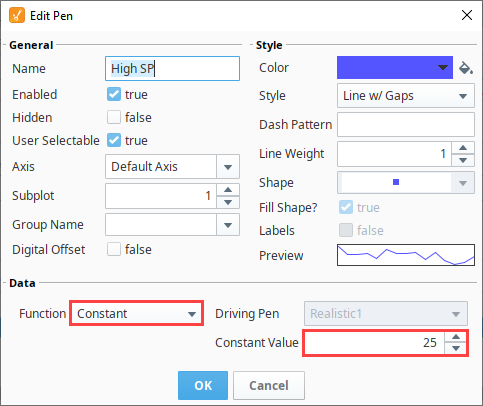
-
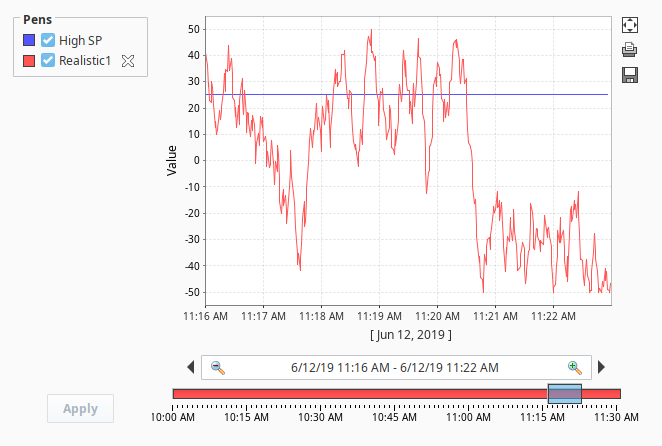
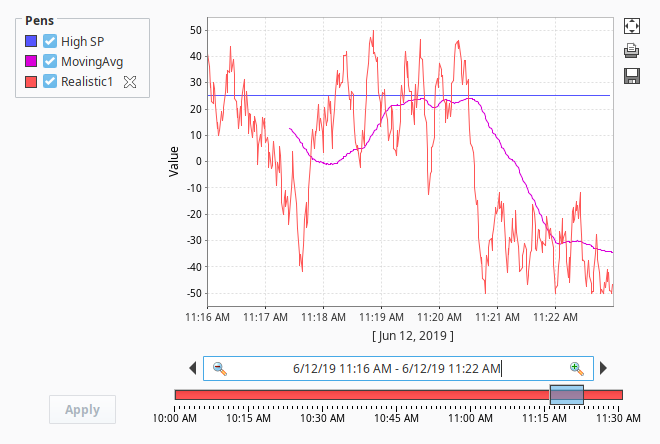
Click OK again to save your pen options. Now, view your High SP pen on your Easy Chart. The High SP value of 25 is represented on your Easy Chart by a blue horizontal line.
-
Next, let's add a second calculated pen. Double click on the Easy Chart to open the Style Customizer. On the Calculated Pens Table at the bottom of the screen. Click the Add
icon. -
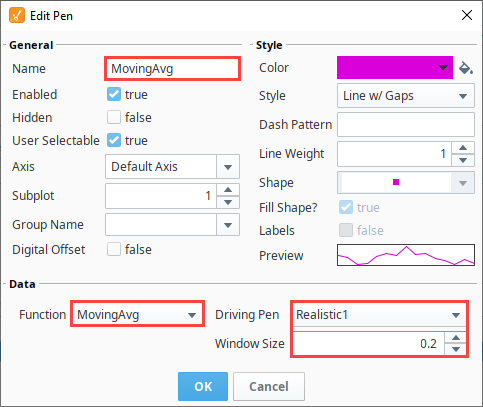
On the Edit Pen window, set the calculated pen options as follows:
- Name: MovingAvg
- Function field: MovingAvg
- Driving Pen: Realistic1
- Window Size: .2
noteIf you have more Tags that you dragged on to your Easy Chart from the Tag Browser, you'll have more pens to choose from in the Driving Pen dropdown list.
-
Click OK. The chart now displays a running average.
-
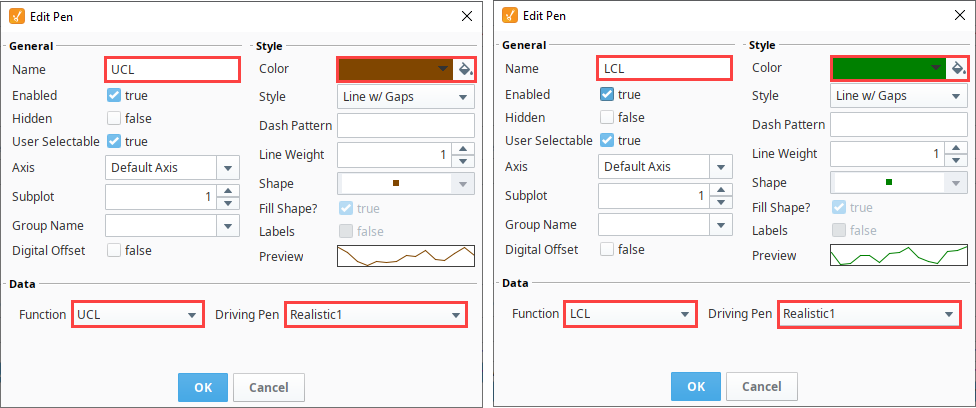
Let's add two more calculated pens: one for Upper Control Limit (UCL) and another for Lower Control Limit (LCL), and set the Driving Property to 'Realistic1.' Select a pen color to change the default color.
-
Once you add all your calculated pens, you'll see all your pens in the Calculated Pens section at bottom of the window. Press OK.
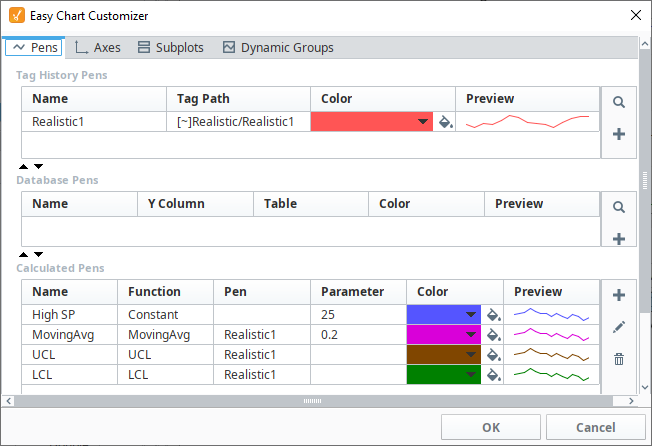
-
Now, all your calculations are displayed on your Easy Chart. The blue pen is the Constant, the pink pen is the Moving Average, and UCL and LCL are brown and green respectively.
Hide Driving Pens
Once you have your Calculated Pens created, you'll notice that they disappear if you disable the pen driving them. If you want to remove the Driving Pen but leave the Calculated Pens, set the Hidden property of the Driving Pen to 'true'.