Easy Chart - Subplots
To learn more, go to the Tag and Configuring Tag History pages. The examples below use OPC PC Tags from the Programmable Device Simulator driver, but Memory Tags can be used instead.
Subplot Overview
The subplot feature of the Easy Chart component allows you to break up the chart plot area into multiple distinct subplots sharing the 'X' axis, but they each have their own 'Y' axis. It is a good way to display lots of data from different Tags in one Easy Chart.
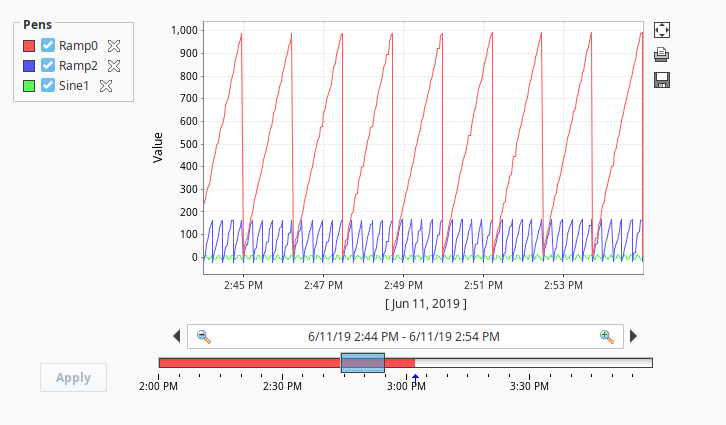
By default, the Easy Chart has one subplot which is the main white area. In this example, there are three Tags inside the chart, yet it's difficult to see the details of the data. It’s possible to break up your Tags into multiple subplots which is often useful for discrete data.
Configuring Easy Chart Subplots
For each Tag in the Easy Chart example above, let's create its own subplot so the data is easier to view and analyze.
-
Drag an Easy Chart component onto your window.
-
Drag three Tags onto the chart. We used Ramp0, Ramp2, and Sine1 from Programmable Device Simulator.
-
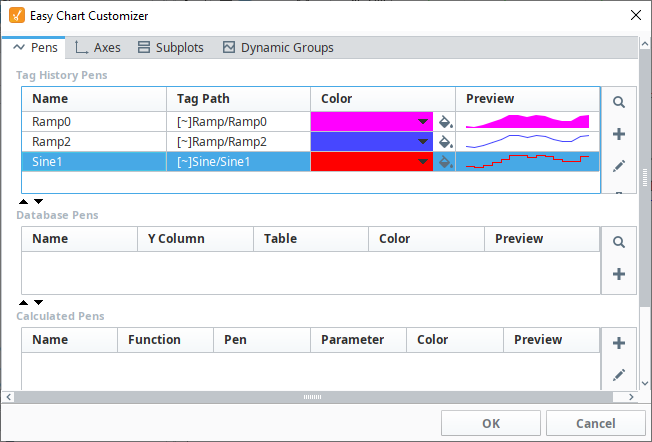
Right click on the Easy Chart component and choose Customizers > Easy Chart Customizer. The Easy Chart Customizer window opens displaying four tabs.
-
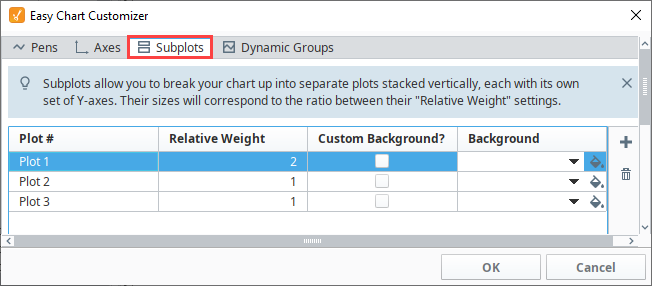
Click on the Subplots tab.
-
The Subplots tab lets you add one or more subplots to the Easy Chart. Create two more subplots by clicking the Add
 icon two more times.
 -
The size of each subplot corresponds to the ratio between their "Relative Weight" settings. By default, each subplot is assigned a weight of 1, meaning each subplot will share an equal percentage of space on the chart. In this example, we set Subplot 1 has a weight of '2', and Subplots 2 and 3 have a weight of '1'. Subplot 1 is going to be 2 times larger than Subplots 2 and 3.
-
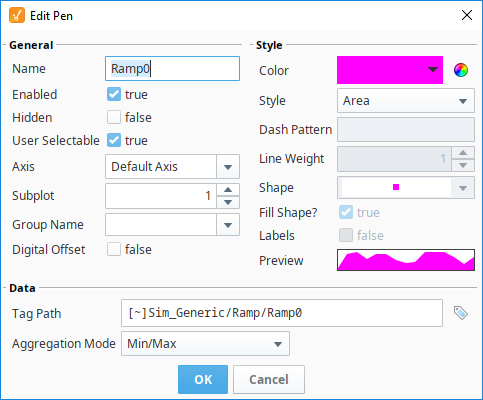
Now that we have subplots, we'll put each of the different pens into a different subplot. Click on the Pens tab, select the row for the Ramp0 Pen, and click the Edit icon. For this example, we chose the following settings:
- Set the Subplot to 1.
- Set the Color to pink.
- Set the Style to Area.
- Click OK.
-
For the Ramp2 pen, we selected the following:
- Subplot: 2
- Color: Blue
- Style: Line w/Gaps
-
For the Sine1 pen, we selected the following:
- Subplot: 3
- Color: Red
- Style: Digital
-
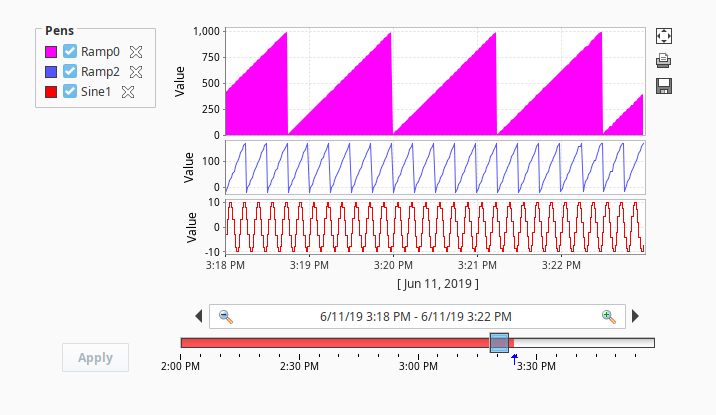
Click OK. Now, you have three distinct subplots on one Easy Chart. You are not limited to the number of subplots on one Easy Chart.
-
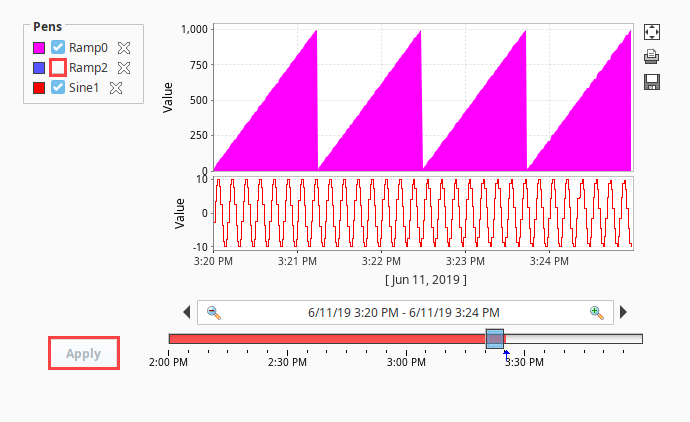
You can be selective about what subplots you want to view. Go to Preview Mode, uncheck the Pens you don't want to see, and click Apply.
-
Notice how the Ramp2 pen is unchecked and is no longer displayed on the Easy Chart. To add the Ramp2 pen back to the Easy Chart, check the Ramp2 pen, and click Apply. The Easy Chart only displays subplots that have active Tags.