XY Chart Example - Heat Map
This example demonstrates how to configure a Heatmap, where the value of each cross axis is represented as a color along a gradient. This style of chart is largely accomplished by setting the series "render" property to "column", and enabling "heatRules".
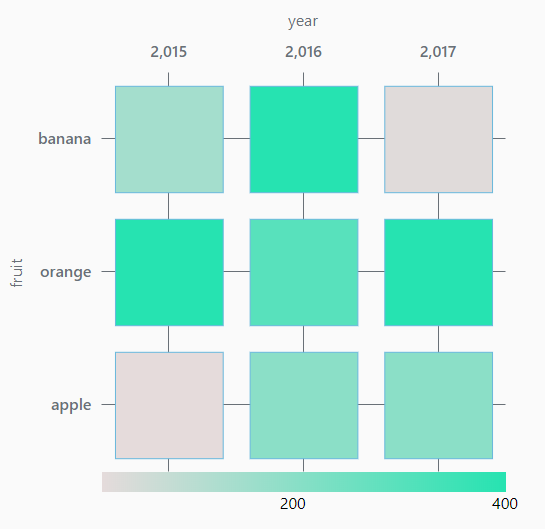
The data used in this example is shown in the code block below: The x-axis is set to the "year" key, while the y-axis is set to the "fruit" key. The "dataField" property under "heatRules" is set to the "count" key.
- year - the x-axis
- fruit - the y-axis
- count - determines the color used in the block.
[
  {
    "year": 2015,
    "fruit": "apple",
    "count": 20
  },
  {
    "year": 2015,
    "fruit": "orange",
    "count": 400
  },
  {
    "year": 2015,
    "fruit": "banana",
    "count": 150
  },
  {
    "year": 2016,
    "fruit": "apple",
    "count": 200
  },
  {
    "year": 2016,
    "fruit": "orange",
    "count": 300
  },
  {
    "year": 2016,
    "fruit": "banana",
    "count": 400
  },
  {
    "year": 2017,
    "fruit": "apple",
    "count": 200
  },
  {
    "year": 2017,
    "fruit": "orange",
    "count": 400
  },
  {
    "year": 2017,
    "fruit": "banana",
    "count": 30
  }
]
Notable Property Configurations
The example requires both an X axis and a Y axis in addition to some series properties.
| PROPS Path | Property Description | Value |
|---|---|---|
xAxes.0.render | Makes the chart group values in the X Axis, and provides equal padding between each category. Partially responsible for rendering boxes on the chart. | category |
yAxes.0.render | Makes the chart group values in the Y Axis, and provides equal padding between each category. Partially responsible for rendering boxes on the chart. | category |
series.0.render | When combined with "category" renders for the X and Y axes, allows the categories boxes to be rendered on the chart. | column |
series.0.column.appearance.heatRules.enabled | Makes the chart change the color on each category based on dataField key ("count", in our example), applying the min and max colors. | true |
series.0.column.appearance.heatRules.max | The property represents which color to use for higher values. | #26E3B1 |
series.0.column.appearance.heatRules.min | The property represents which color to use for lower values. | #E5DBDB (pick a color you want to represent low colors) |
series.0.column.appearance.heatRules.dataField | Determines which key in the underlying data should be used to determine the vibrancy of each block. | count |
Example Configuration
The JSON string below can be used to replicate the heatmap example. Simply copy the contents of the code block below (double-click on any part of the JSON to select all of it) , and paste it into a container in your Designer.
[
{
"type": "ia.chart.xy",
"version": 0,
"props": {
"legend": {
"enabled": false
},
"xAxes": [
{
"name": "year",
"label": {
"enabled": true,
"text": "year",
"color": ""
},
"visible": true,
"tooltip": {
"enabled": true,
"text": "",
"cornerRadius": 3,
"pointerLength": 4,
"background": {
"color": "",
"opacity": 1
}
},
"inversed": false,
"render": "category",
"category": {
"break": {
"enabled": false,
"startCategory": "",
"endCategory": "",
"size": 0.05
}
},
"date": {
"baseInterval": {
"enabled": false,
"timeUnit": "hour",
"count": 1,
"skipEmptyPeriods": false
},
"range": {
"max": "",
"min": "",
"useStrict": false
},
"break": {
"enabled": false,
"startDate": "",
"endDate": "",
"size": 0.05
},
"inputFormat": "yyyy-MM-dd kk:mm:ss",
"format": "M/d"
},
"value": {
"range": {
"max": "",
"min": "",
"useStrict": false
},
"logarithmic": false,
"break": {
"enabled": false,
"startValue": 0,
"endValue": 100,
"size": 0.05
},
"format": "#,###.##"
},
"appearance": {
"opposite": true,
"inside": false,
"labels": {
"color": "",
"opacity": 1
},
"grid": {
"color": "",
"opacity": 1,
"dashArray": "",
"minDistance": 60,
"position": 0.5
},
"font": {
"size": "",
"weight": 500
}
}
}
],
"yAxes": [
{
"name": "fruit",
"label": {
"enabled": true,
"text": "fruit",
"color": ""
},
"visible": true,
"tooltip": {
"enabled": true,
"text": "",
"cornerRadius": 3,
"pointerLength": 4,
"background": {
"color": "",
"opacity": 1
}
},
"inversed": false,
"render": "category",
"category": {
"break": {
"enabled": false,
"startCategory": "",
"endCategory": "",
"size": 0.05
}
},
"date": {
"baseInterval": {
"enabled": false,
"timeUnit": "hour",
"count": 1,
"skipEmptyPeriods": false
},
"range": {
"max": "",
"min": "",
"useStrict": false
},
"break": {
"enabled": false,
"startDate": "",
"endDate": "",
"size": 0.05
},
"inputFormat": "yyyy-MM-dd kk:mm:ss",
"format": "M/d/yyyy HH:mm:ss"
},
"value": {
"range": {
"max": "",
"min": "",
"useStrict": false
},
"logarithmic": false,
"break": {
"enabled": false,
"startValue": 0,
"endValue": 100,
"size": 0.05
},
"format": "#,###.##"
},
"appearance": {
"opposite": false,
"inside": false,
"labels": {
"color": "",
"opacity": 1
},
"grid": {
"color": "",
"opacity": 1,
"dashArray": "",
"minDistance": null,
"position": 0.5
},
"font": {
"size": "",
"weight": 500
}
}
}
],
"series": [
{
"name": "count",
"label": {
"text": "Process Temp"
},
"visible": true,
"hiddenInLegend": false,
"defaultState": {
"visible": true
},
"data": {
"source": "data",
"x": "year",
"y": "fruit"
},
"xAxis": "year",
"yAxis": "fruit",
"zIndex": 0,
"tooltip": {
"enabled": true,
"text": "{name}: [bold]{valueY}[/]",
"cornerRadius": 3,
"pointerLength": 4,
"background": {
"color": "",
"opacity": 1
}
},
"render": "column",
"candlestick": {
"open": {
"x": "",
"y": ""
},
"high": {
"x": "",
"y": ""
},
"low": {
"x": "",
"y": ""
},
"appearance": {
"fill": {
"color": "",
"opacity": 1
},
"stroke": {
"color": "",
"opacity": 1,
"width": 1
},
"stacked": false,
"deriveFieldsFromData": {
"fill": {
"color": "",
"opacity": ""
},
"stroke": {
"color": "",
"opacity": "",
"width": ""
}
},
"heatRules": {
"enabled": false,
"max": "",
"min": "",
"dataField": ""
}
}
},
"column": {
"open": {
"x": "",
"y": ""
},
"appearance": {
"fill": {
"color": "",
"opacity": 1
},
"stroke": {
"color": "",
"opacity": 1,
"width": 1
},
"stacked": false,
"width": null,
"height": null,
"deriveFieldsFromData": {
"fill": {
"color": "",
"opacity": ""
},
"stroke": {
"color": "",
"opacity": "",
"width": ""
}
},
"heatRules": {
"enabled": true,
"max": "#26E3B1",
"min": "#E5DBDB",
"dataField": "count"
}
}
},
"line": {
"open": {
"x": "",
"y": ""
},
"appearance": {
"connect": true,
"tensionX": 1,
"tensionY": 1,
"minDistance": 0.5,
"stroke": {
"width": 3,
"opacity": 1,
"color": "",
"dashArray": ""
},
"fill": {
"opacity": 0,
"color": ""
},
"bullets": [
{
"enabled": false,
"render": "circle",
"width": 10,
"height": 10,
"label": {
"text": "{value}",
"position": {
"dx": 0,
"dy": 0
}
},
"fill": {
"color": "",
"opacity": 1
},
"stroke": {
"color": "",
"opacity": 1,
"width": 1
},
"rotation": 0,
"tooltip": {
"enabled": true,
"text": "{name}: [bold]{valueY}[/]",
"cornerRadius": 3,
"pointerLength": 4,
"background": {
"color": "",
"opacity": 1
}
},
"deriveFieldsFromData": {
"fill": {
"color": "",
"opacity": ""
},
"stroke": {
"color": "",
"opacity": "",
"width": ""
},
"rotation": ""
},
"heatRules": {
"enabled": false,
"max": 100,
"min": 2,
"dataField": ""
}
}
]
}
},
"stepLine": {
"open": {
"x": "",
"y": ""
},
"appearance": {
"connect": true,
"tensionX": 1,
"tensionY": 1,
"minDistance": 0.5,
"stroke": {
"width": 3,
"opacity": 1,
"color": "",
"dashArray": ""
},
"fill": {
"opacity": 0,
"color": ""
},
"bullets": [
{
"enabled": true,
"render": "circle",
"width": 10,
"height": 10,
"label": {
"text": "{value}",
"position": {
"dx": 0,
"dy": 0
}
},
"fill": {
"color": "",
"opacity": 1
},
"stroke": {
"color": "",
"opacity": 1,
"width": 1
},
"rotation": 0,
"tooltip": {
"enabled": true,
"text": "{name}: [bold]{valueY}[/]",
"cornerRadius": 3,
"pointerLength": 4,
"background": {
"color": "",
"opacity": 1
}
},
"deriveFieldsFromData": {
"fill": {
"color": "",
"opacity": ""
},
"stroke": {
"color": "",
"opacity": "",
"width": ""
},
"rotation": ""
},
"heatRules": {
"enabled": false,
"max": 100,
"min": 2,
"dataField": ""
}
}
]
}
}
}
],
"style": {
"marginRight": "100px",
"paddingRight": "100px"
},
"dataSources": {
"data": [
{
"year": 2015,
"fruit": "apple",
"count": 20
},
{
"year": 2015,
"fruit": "orange",
"count": 400
},
{
"year": 2015,
"fruit": "banana",
"count": 150
},
{
"year": 2016,
"fruit": "apple",
"count": 200
},
{
"year": 2016,
"fruit": "orange",
"count": 300
},
{
"year": 2016,
"fruit": "banana",
"count": 400
},
{
"year": 2017,
"fruit": "apple",
"count": 200
},
{
"year": 2017,
"fruit": "orange",
"count": 400
},
{
"year": 2017,
"fruit": "banana",
"count": 30
}
]
}
},
"meta": {
"name": "XYChart"
},
"position": {
"basis": "536px"
},
"custom": {}
}
]