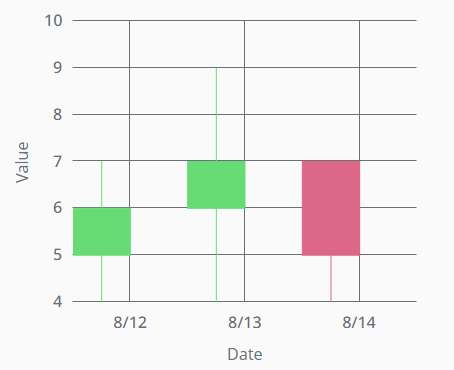
XY Chart Example - Candlestick Chart
This example demonstrates how to configure a candlestick chart. The candlestick chart needs five keys per entry on the chart: a key to represent the date of the entry and four keys that make up the candlestick. These four keys are called open, close, high, and low. These dedicated key properties are visible under the series when the render selection is set to candlestick, and therefore this chart does not require that the keys under dataSources use the exact naming conventions as shown on this page.
Configure a Candlestick Chart
-
Create an XY chart component and select it.
-
Copy the JSON content below, and paste it onto the chart component's dataSources.example property.
[
{
    "close": 6,
    "date": "2021-8-12 15:37:19",
    "high": 7,
    "low": 2,
    "open": 5
},
{
    "close": 7,
    "date": "2021-8-13 15:37:19",
    "high": 9,
    "low": 5,
    "open": 6
},
{
    "close": 5,
    "date": "2021-8-14 15:37:19",
    "high": 7,
    "low": 4,
    "open": 7
}
] -
Remove the legend by setting legend.enabled to false.
-
Rename xAxes.0.name to
dateAxis. -
Set xAxes.0.label.text to
Date, to change the label on the x-axis.
-
Our chart only needs a single y-axis, so delete yAxes.1.
-
Set yAxes.0.name to
valuation. -
Set yAxes.0.label.text to
Value. -
Delete series.1 since we only need a single series for this example.
-
Navigate to the series.0.data property and make sure the source is still
examplefrom the JSON string pasted in step 2. -
Set series.0.data.x to the
datekey -
Set series.0.data.y to the
closekey. -
Set series.0.xAxis to the xAxes:
dateAxis. -
Set series.0.yAxis to the yAxes:
valuation. -
Set series.0.render to
candlestick. -
Expand the now visible candlestick properties and set the open, high, and low keys:
-
series.0.candlestick.open: set x to
dateand y toopen. -
series.0.candlestick.high: set x to
dateand y tohigh. -
series.0.candlestick.low: set x, to
dateand y tolow.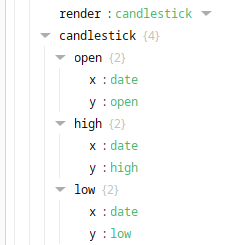
-
Your candlestick chart is now ready. Note that the third entry is in red, while the first two are green. This is because that entry's close value is less than it's open value.
Example Configuration
The JSON string below can be used to replicate the example above. Simply copy the contents of the code block and paste it into a container in your Designer.
[
{
"type": "ia.chart.xy",
"version": 0,
"props": {
"legend": {
"enabled": false
},
"xAxes": [
{
"name": "dateAxis",
"label": {
"enabled": true,
"text": "Date",
"color": ""
},
"visible": true,
"tooltip": {
"enabled": true,
"text": "",
"cornerRadius": 3,
"pointerLength": 4,
"background": {
"color": "",
"opacity": 1
}
},
"inversed": false,
"render": "date",
"category": {
"break": {
"enabled": false,
"startCategory": "",
"endCategory": "",
"size": 0.05
}
},
"date": {
"baseInterval": {
"enabled": false,
"timeUnit": "hour",
"count": 1,
"skipEmptyPeriods": false
},
"range": {
"max": "",
"min": "",
"useStrict": false
},
"break": {
"enabled": false,
"startDate": "",
"endDate": "",
"size": 0.05
},
"inputFormat": "yyyy-MM-dd kk:mm:ss",
"format": "M/d"
},
"value": {
"range": {
"max": "",
"min": "",
"useStrict": false
},
"logarithmic": false,
"break": {
"enabled": false,
"startValue": 0,
"endValue": 100,
"size": 0.05
},
"format": "#,###.##"
},
"appearance": {
"opposite": false,
"inside": false,
"labels": {
"color": "",
"opacity": 1
},
"grid": {
"color": "",
"opacity": 1,
"dashArray": "",
"minDistance": 60,
"position": 0.5
},
"font": {
"size": "",
"weight": 500
}
}
}
],
"yAxes": [
{
"name": "valuation",
"label": {
"enabled": true,
"text": "Value",
"color": ""
},
"visible": true,
"tooltip": {
"enabled": true,
"text": "",
"cornerRadius": 3,
"pointerLength": 4,
"background": {
"color": "",
"opacity": 1
}
},
"inversed": false,
"render": "value",
"category": {
"break": {
"enabled": false,
"startCategory": "",
"endCategory": "",
"size": 0.05
}
},
"date": {
"baseInterval": {
"enabled": false,
"timeUnit": "hour",
"count": 1,
"skipEmptyPeriods": false
},
"range": {
"max": "",
"min": "",
"useStrict": false
},
"break": {
"enabled": false,
"startDate": "",
"endDate": "",
"size": 0.05
},
"inputFormat": "yyyy-MM-dd kk:mm:ss",
"format": "M/d/yyyy HH:mm:ss"
},
"value": {
"range": {
"max": "",
"min": "",
"useStrict": false
},
"logarithmic": false,
"break": {
"enabled": false,
"startValue": 0,
"endValue": 100,
"size": 0.05
},
"format": "#,###.##"
},
"appearance": {
"opposite": false,
"inside": false,
"labels": {
"color": "",
"opacity": 1
},
"grid": {
"color": "",
"opacity": 1,
"dashArray": "",
"minDistance": null,
"position": 0.5
},
"font": {
"size": "",
"weight": 500
}
}
}
],
"series": [
{
"name": "process temp",
"label": {
"text": "Process Temp"
},
"visible": true,
"hiddenInLegend": false,
"defaultState": {
"visible": true
},
"data": {
"source": "example",
"x": "date",
"y": "close"
},
"xAxis": "dateAxis",
"yAxis": "valuation",
"zIndex": 0,
"tooltip": {
"enabled": true,
"text": "{name}: [bold]{valueY}[/]",
"cornerRadius": 3,
"pointerLength": 4,
"background": {
"color": "",
"opacity": 1
}
},
"render": "candlestick",
"candlestick": {
"open": {
"x": "date",
"y": "open"
},
"high": {
"x": "date",
"y": "high"
},
"low": {
"x": "date",
"y": "low"
},
"appearance": {
"fill": {
"color": "",
"opacity": 1
},
"stroke": {
"color": "",
"opacity": 1,
"width": 1
},
"stacked": false,
"deriveFieldsFromData": {
"fill": {
"color": "",
"opacity": ""
},
"stroke": {
"color": "",
"opacity": "",
"width": ""
}
},
"heatRules": {
"enabled": false,
"max": "",
"min": "",
"dataField": ""
}
}
},
"column": {
"open": {
"x": "",
"y": ""
},
"appearance": {
"fill": {
"color": "",
"opacity": 1
},
"stroke": {
"color": "",
"opacity": 1,
"width": 1
},
"stacked": false,
"width": null,
"height": null,
"deriveFieldsFromData": {
"fill": {
"color": "",
"opacity": ""
},
"stroke": {
"color": "",
"opacity": "",
"width": ""
}
},
"heatRules": {
"enabled": false,
"max": "",
"min": "",
"dataField": ""
}
}
},
"line": {
"open": {
"x": "",
"y": ""
},
"appearance": {
"connect": true,
"tensionX": 1,
"tensionY": 1,
"minDistance": 0.5,
"stroke": {
"width": 3,
"opacity": 1,
"color": "",
"dashArray": ""
},
"fill": {
"opacity": 0,
"color": ""
},
"bullets": [
{
"enabled": false,
"render": "circle",
"width": 10,
"height": 10,
"label": {
"text": "{value}",
"position": {
"dx": 0,
"dy": 0
}
},
"fill": {
"color": "",
"opacity": 1
},
"stroke": {
"color": "",
"opacity": 1,
"width": 1
},
"rotation": 0,
"tooltip": {
"enabled": true,
"text": "{name}: [bold]{valueY}[/]",
"cornerRadius": 3,
"pointerLength": 4,
"background": {
"color": "",
"opacity": 1
}
},
"deriveFieldsFromData": {
"fill": {
"color": "",
"opacity": ""
},
"stroke": {
"color": "",
"opacity": "",
"width": ""
},
"rotation": ""
},
"heatRules": {
"enabled": false,
"max": 100,
"min": 2,
"dataField": ""
}
}
]
}
},
"stepLine": {
"open": {
"x": "",
"y": ""
},
"appearance": {
"connect": true,
"tensionX": 1,
"tensionY": 1,
"minDistance": 0.5,
"stroke": {
"width": 3,
"opacity": 1,
"color": "",
"dashArray": ""
},
"fill": {
"opacity": 0,
"color": ""
},
"bullets": [
{
"enabled": true,
"render": "circle",
"width": 10,
"height": 10,
"label": {
"text": "{value}",
"position": {
"dx": 0,
"dy": 0
}
},
"fill": {
"color": "",
"opacity": 1
},
"stroke": {
"color": "",
"opacity": 1,
"width": 1
},
"rotation": 0,
"tooltip": {
"enabled": true,
"text": "{name}: [bold]{valueY}[/]",
"cornerRadius": 3,
"pointerLength": 4,
"background": {
"color": "",
"opacity": 1
}
},
"deriveFieldsFromData": {
"fill": {
"color": "",
"opacity": ""
},
"stroke": {
"color": "",
"opacity": "",
"width": ""
},
"rotation": ""
},
"heatRules": {
"enabled": false,
"max": 100,
"min": 2,
"dataField": ""
}
}
]
}
}
}
],
"dataSources": {
"example": [
{
"close": 6,
"date": "2021-8-12 15:37:19",
"high": 7,
"low": 2,
"open": 5
},
{
"close": 7,
"date": "2021-8-13 15:37:19",
"high": 9,
"low": 5,
"open": 6
},
{
"close": 5,
"date": "2021-8-14 15:37:19",
"high": 7,
"low": 4,
"open": 7
}
]
}
},
"meta": {
"name": "XYChart_0"
},
"position": {
"x": 141,
"y": 103,
"height": 375,
"width": 435
},
"custom": {}
}
]