XY Chart Example - Gantt Chart
In addition to basic data plotting, an XY Chart can be used to plot horizontal bar across different lanes, in this fashion:
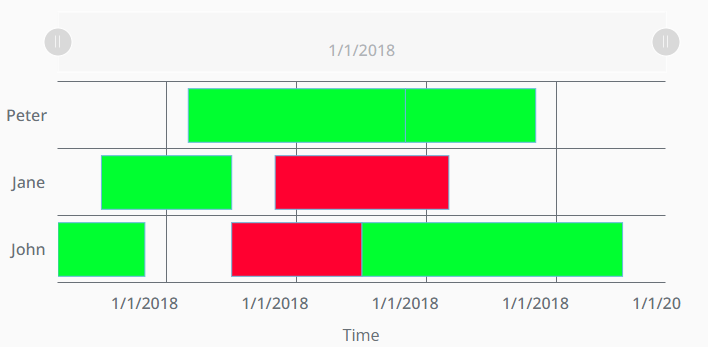
This can useful when it comes to machine downtime scheduling, shift scheduling, and maintenance scheduling. To achieve this functionality with the XY Chart, follow the example below:
-
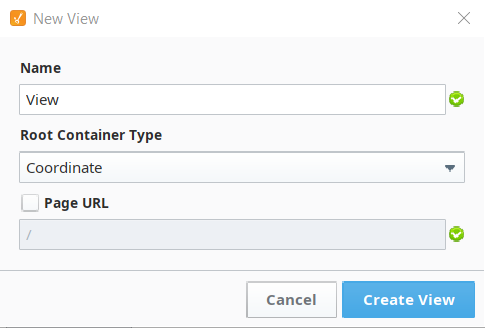
From the Perspective section of the Project Browser on your Designer, right click on the Views folder and select New View... to create a new view.
-
This will bring up the New View window. Give your view a name and select the Coordinate Root Container Type. The Page URL setting will remain unchecked for this example.
-
From the Perspective Component Palette, drag and drop a XY Chart onto your newly created view.
-
Click to select your newly added XY Chart and from the property editor, click on the + icon next to the dataSources property and select Array to create a new data source array and name it schedule_data.

-
Right-click on your newly created schedule_data dataSource and paste the following:
[
{
    "name": "John",
    "fromDate": "2018-01-01 08:00",
    "toDate": "2018-01-01 10:00",
    "color": "#00FF30"
},
{
    "name": "John",
    "fromDate": "2018-01-01 12:00",
    "toDate": "2018-01-01 15:00",
    "color": "#FF0030"
},
{
    "name": "John",
    "fromDate": "2018-01-01 15:30",
    "toDate": "2018-01-01 21:30",
    "color": "#00FF30"
},
{
    "name": "Jane",
    "fromDate": "2018-01-01 09:00",
    "toDate": "2018-01-01 12:00",
    "color": "#00FF30"
},
{
    "name": "Jane",
    "fromDate": "2018-01-01 13:00",
    "toDate": "2018-01-01 17:00",
    "color": "#FF0030"
},
{
    "name": "Peter",
    "fromDate": "2018-01-01 11:00",
    "toDate": "2018-01-01 16:00",
    "color": "#00FF30"
},
{
    "name": "Peter",
    "fromDate": "2018-01-01 16:00",
    "toDate": "2018-01-01 19:00",
    "color": "#00FF30"
}
]noteAny data that you wish to plot on the XY Chart to build a Gantt Chart needs to come in the format specified by the schedule_data property above.
-
Set XY Chart's variables cursor.series and scrollbars.horizontal.series to "schedule data".
-
Set legend.enabled to false, to disable the legend.
-
Set the X axes properties as follows:
- Configure the X axes date format by setting the property xAxes[0].date.format to be a date format that works for you. For this example, we chose date from the dropdown, which sets it to "M/d/yyyy".
- Set the properties xAxes[0].appearance.grid.minDistance to NULL.
-
Set the Y axes properties as follows:
- Delete the yAxes[1] property since it will not be used.
- Set the property yAxes[0].name to "Operator".
- Disable the Y axes label by setting the yAxes[0].label.enabled property to false.
- Set the property yAxes[0].render to "category".
- Set your yAxes[0].appearance.grid.position to "0".
-
Set the series properties as follows:
- Delete the series[1] property since it will not be used.
- Set your series[0].name to "schedule data". This links your Horizontal Scroll bar from step 6 to your chart's series.
- Set your series[0].data.source to "schedule_data". This links your chart's series to your data source from step 4.
- Configure your series[0].data.x to be "toDate" and your series[0].data.y to be "name".
- Configure your series[0].xAxis to be "time" and your series[0].yAxis to be "Operator".
- Set your series[0].render property to "column".
- Your series[0].column.open.x property must be set to "fromDate".
- To help with data visualization, set your series[0].tooltip.text to
{name}: [bold]{fromDate} - {toDate}[/].
-
Our data includes a key for color, but our chart isn't currently using it. Set series[0].column.appearance.deriveFieldsFromData.fill.color to "color". This will map the "color" key in our data source to each block in the chart.
-
Save your project.
-
Put the Designer into Preview mode to see the chart in action.
Example Configuration
The JSON string below can be used to replicate the heatmap example. Simply copy the contents of the code block below (double-click on any part of the JSON to select all of it) , and paste it into a container in your Designer.
[
{
"type": "ia.chart.xy",
"version": 0,
"props": {
"legend": {
"enabled": false
},
"cursor": {
"series": "mySeries"
},
"scrollBars": {
"horizontal": {
"series": "mySeries"
}
},
"xAxes": [
{
"name": "time",
"label": {
"enabled": true,
"text": "Time",
"color": ""
},
"visible": true,
"tooltip": {
"enabled": true,
"text": "",
"cornerRadius": 3,
"pointerLength": 4,
"background": {
"color": "",
"opacity": 1
}
},
"inversed": false,
"render": "date",
"category": {
"break": {
"enabled": false,
"startCategory": "",
"endCategory": "",
"size": 0.05
}
},
"date": {
"baseInterval": {
"enabled": false,
"timeUnit": "hour",
"count": 1,
"skipEmptyPeriods": false
},
"range": {
"max": "",
"min": "",
"useStrict": false
},
"break": {
"enabled": false,
"startDate": "",
"endDate": "",
"size": 0.05
},
"inputFormat": "yyyy-MM-dd kk:mm:ss",
"format": "M/d/yyyy"
},
"value": {
"range": {
"max": "",
"min": "",
"useStrict": false
},
"logarithmic": false,
"break": {
"enabled": false,
"startValue": 0,
"endValue": 100,
"size": 0.05
},
"format": "#,###.##"
},
"appearance": {
"opposite": false,
"inside": false,
"labels": {
"color": "",
"opacity": 1
},
"grid": {
"color": "",
"opacity": 1,
"dashArray": "",
"minDistance": 60,
"position": 0.5
},
"font": {
"size": "",
"weight": 500
}
}
}
],
"yAxes": [
{
"name": "Operator",
"label": {
"enabled": false,
"text": "Process Temp",
"color": ""
},
"visible": true,
"tooltip": {
"enabled": true,
"text": "",
"cornerRadius": 3,
"pointerLength": 4,
"background": {
"color": "",
"opacity": 1
}
},
"inversed": false,
"render": "category",
"category": {
"break": {
"enabled": false,
"startCategory": "",
"endCategory": "",
"size": 0.05
}
},
"date": {
"baseInterval": {
"enabled": false,
"timeUnit": "hour",
"count": 1,
"skipEmptyPeriods": false
},
"range": {
"max": "",
"min": "",
"useStrict": false
},
"break": {
"enabled": false,
"startDate": "",
"endDate": "",
"size": 0.05
},
"inputFormat": "yyyy-MM-dd kk:mm:ss",
"format": "M/d/yyyy HH:mm:ss"
},
"value": {
"range": {
"max": "",
"min": "",
"useStrict": false
},
"logarithmic": false,
"break": {
"enabled": false,
"startValue": 0,
"endValue": 100,
"size": 0.05
},
"format": "#,###.##"
},
"appearance": {
"opposite": false,
"inside": false,
"labels": {
"color": "",
"opacity": 1
},
"grid": {
"color": "",
"opacity": 1,
"dashArray": "",
"minDistance": null,
"position": 0
},
"font": {
"size": "",
"weight": 500
}
}
}
],
"series": [
{
"name": "mySeries",
"label": {
"text": "Process Temp"
},
"visible": true,
"hiddenInLegend": false,
"defaultState": {
"visible": true
},
"data": {
"source": "example",
"x": "toDate",
"y": "name"
},
"xAxis": "time",
"yAxis": "Operator",
"zIndex": 0,
"tooltip": {
"enabled": true,
"text": "{name}: [bold]{fromDate} - {toDate}[/]",
"cornerRadius": 3,
"pointerLength": 4,
"background": {
"color": "",
"opacity": 1
}
},
"render": "column",
"candlestick": {
"open": {
"x": "",
"y": ""
},
"high": {
"x": "",
"y": ""
},
"low": {
"x": "",
"y": ""
},
"appearance": {
"fill": {
"color": "",
"opacity": 1
},
"stroke": {
"color": "",
"opacity": 1,
"width": 1
},
"stacked": false,
"deriveFieldsFromData": {
"fill": {
"color": "",
"opacity": ""
},
"stroke": {
"color": "",
"opacity": "",
"width": ""
}
},
"heatRules": {
"enabled": false,
"max": "",
"min": "",
"dataField": ""
}
}
},
"column": {
"open": {
"x": "fromDate",
"y": ""
},
"appearance": {
"fill": {
"color": "",
"opacity": 1
},
"stroke": {
"color": "",
"opacity": 1,
"width": 1
},
"stacked": false,
"width": null,
"height": null,
"deriveFieldsFromData": {
"fill": {
"color": "color",
"opacity": ""
},
"stroke": {
"color": "",
"opacity": "",
"width": ""
}
},
"heatRules": {
"enabled": false,
"max": "",
"min": "",
"dataField": ""
}
}
},
"line": {
"open": {
"x": "",
"y": ""
},
"appearance": {
"connect": true,
"tensionX": 1,
"tensionY": 1,
"minDistance": 0.5,
"stroke": {
"width": 3,
"opacity": 1,
"color": "",
"dashArray": ""
},
"fill": {
"opacity": 0,
"color": ""
},
"bullets": [
{
"enabled": false,
"render": "circle",
"width": 10,
"height": 10,
"label": {
"text": "{value}",
"position": {
"dx": 0,
"dy": 0
}
},
"fill": {
"color": "",
"opacity": 1
},
"stroke": {
"color": "",
"opacity": 1,
"width": 1
},
"rotation": 0,
"tooltip": {
"enabled": true,
"text": "{name}: [bold]{valueY}[/]",
"cornerRadius": 3,
"pointerLength": 4,
"background": {
"color": "",
"opacity": 1
}
},
"deriveFieldsFromData": {
"fill": {
"color": "",
"opacity": ""
},
"stroke": {
"color": "",
"opacity": "",
"width": ""
},
"rotation": ""
},
"heatRules": {
"enabled": false,
"max": 100,
"min": 2,
"dataField": ""
}
}
]
}
},
"stepLine": {
"open": {
"x": "",
"y": ""
},
"appearance": {
"connect": true,
"tensionX": 1,
"tensionY": 1,
"minDistance": 0.5,
"stroke": {
"width": 3,
"opacity": 1,
"color": "",
"dashArray": ""
},
"fill": {
"opacity": 0,
"color": ""
},
"bullets": [
{
"enabled": true,
"render": "circle",
"width": 10,
"height": 10,
"label": {
"text": "{value}",
"position": {
"dx": 0,
"dy": 0
}
},
"fill": {
"color": "",
"opacity": 1
},
"stroke": {
"color": "",
"opacity": 1,
"width": 1
},
"rotation": 0,
"tooltip": {
"enabled": true,
"text": "{name}: [bold]{valueY}[/]",
"cornerRadius": 3,
"pointerLength": 4,
"background": {
"color": "",
"opacity": 1
}
},
"deriveFieldsFromData": {
"fill": {
"color": "",
"opacity": ""
},
"stroke": {
"color": "",
"opacity": "",
"width": ""
},
"rotation": ""
},
"heatRules": {
"enabled": false,
"max": 100,
"min": 2,
"dataField": ""
}
}
]
}
}
}
],
"dataSources": {
"example": [
{
"name": "John",
"fromDate": "2018-01-01 08:00",
"toDate": "2018-01-01 10:00",
"color": "#00FF30"
},
{
"name": "John",
"fromDate": "2018-01-01 12:00",
"toDate": "2018-01-01 15:00",
"color": "#FF0030"
},
{
"name": "John",
"fromDate": "2018-01-01 15:30",
"toDate": "2018-01-01 21:30",
"color": "#00FF30"
},
{
"name": "Jane",
"fromDate": "2018-01-01 09:00",
"toDate": "2018-01-01 12:00",
"color": "#00FF30"
},
{
"name": "Jane",
"fromDate": "2018-01-01 13:00",
"toDate": "2018-01-01 17:00",
"color": "#FF0030"
},
{
"name": "Peter",
"fromDate": "2018-01-01 11:00",
"toDate": "2018-01-01 16:00",
"color": "#00FF30"
},
{
"name": "Peter",
"fromDate": "2018-01-01 16:00",
"toDate": "2018-01-01 19:00",
"color": "#00FF30"
}
]
}
},
"meta": {
"name": "XYChart_1"
},
"position": {
"x": 36.5,
"y": 271,
"height": 375,
"width": 700
},
"custom": {}
}
]