Historian in Vision
The Historian records tag data using configured history providers, which define how and where data is stored. These providers can use databases, local files, or other storage systems.
The Vision module includes several Chart components that can retrieve and display this historical data.
The Easy Chart
The Easy Chart displays historical tag data from configured history providers. It's quick to configure and includes an Easy Chart Customizer that contains settings to adjust the chart's appearance and behavior.

The Classic Chart
The Classic Chart supports both time-based and category-based trends, making it useful for data that is not organized by timestamp. It retrieves data from configured history providers and offers flexible visualization options.

The Sparkline Chart
The Sparkline Chart provides compact trend lines for historical data from configured history providers. Its minimal design makes it ideal for High Performance HMI applications, where muted colors and lines highlight key information.

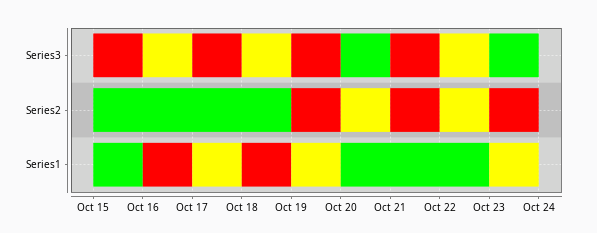
The Status Chart
The Status Chart visualizes discrete or categorical data over time, such as machine states or process modes. It supports both wide and tall data formats, allowing flexibility in how historical information is organized.