Output Console
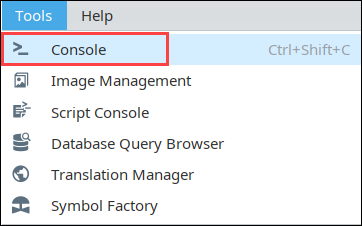
The Output Console is a dockable panel that you can open via Tools > Script Console menu or the Ctrl-Shift-C keyboard shortcut. The Output Console prints system messages that are coming from the Designer. This can vary from simple info messages that show when things are loaded, to error messages when something goes wrong. The Console is also frequently used to test and debug Python scripts, as print statements on components that are run in the Designer are printed here.

For example, by using the print function in your script, you can observe the inner workings of your script as it executes. If you executed the following script:
# A Python script that demonstrates the print statement.

print "Print me first"
x=10
z=2
print x, y, x/y

#Result looks like this:
#Print me first
#10 2 5
Gateway-scoped information will not appear in either the Output Console or Script Console. Instead, the output will be sent to the wrapper.log file. Alternatively, system.util.getLogger() will send messages to the Gateway Console, and is a preferred method of troubleshooting Gateway scoped scripts.
The Output Console is most frequently used to test and debug Python scripts on components in Ignition. By using the print keyword in your script, you can observe the inner workings of your script as it executes. For example, if you executed the following script:
# A function that intercepts tag writes, printing out the previous value first.
def writeToTag(path, value):
   prevValue = system.tag.getTagValue(path)
   print "Writing value '%s' to %s, was previously '%s'" % (value, path, prevValue)
   system.tag.writeToTag(path, value)

writeToTag("Compressor/HOA", 2)
It would print the following to the console:
Writing value '2' to Compressor/HOA, was previously '0'
The Output Console is also available in the Vision Client from Help > Diagnostics and selecting the Console tab.