Diagnostics - Metrics Dashboard
The Metrics Dashboard allows users to visualize a variety of metrics on their own customizable dashboards. Users may browse and search for any registered metric and add it to a dashboard, expanding the diagnostic capabilities available on the Status page. With the addition of this dashboard, developers can contribute diagnostics to the Status page without any additional UI design.
User Interface

| Attribute | Description |
|---|---|
| Add Metric | Select from a list of available metrics to drag and drop onto the dashboard grid. |
| Grid Size | Control the number of rows and columns on the grid. |
| Reset | Clear all metrics tiles from the current dashboard. |
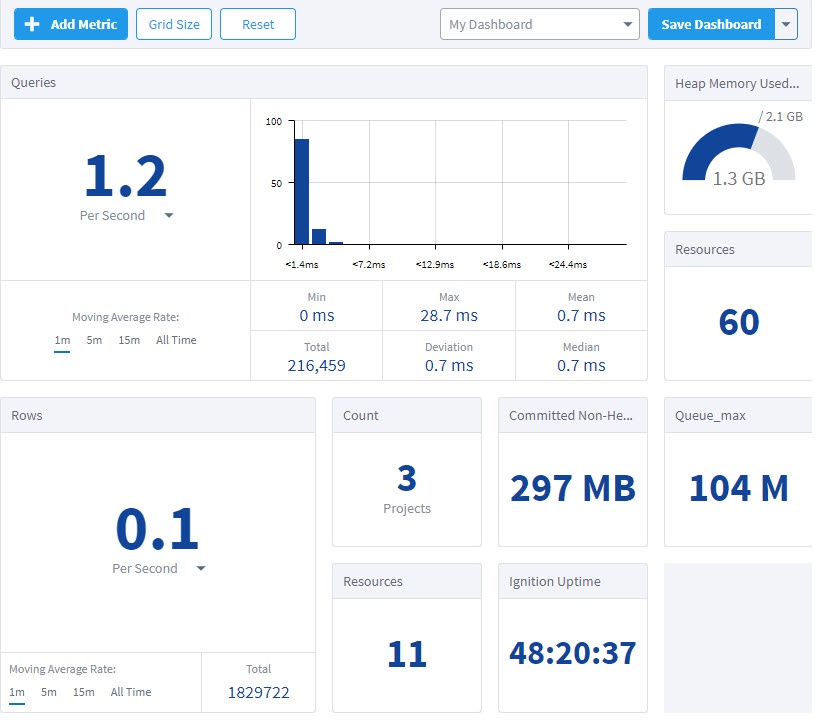
| Dashboard Dropdown | Switch between saved dashboards. |
| Save Dashboard Dropdown | Save changes, rename a saved dashboard, or delete the current dashboard. |
Types of Metrics
Gauge
Gauges can be any kind of instant-read measurement, such as the number of megabytes of memory consumed, the count of faulted database connections, or the length of a pending task queue. Gauges are used to display a dynamic number.

| Property | Description |
|---|---|
| value | A numeric value. |
X/Y
An X/Y metric is a pair of gauges that can be interpreted as a ratio. This is an instant-read gauge on a value that has a maximum, such as heap size or a fixed-size thread pool.

| Property | Description |
|---|---|
| value | A numeric value. |
| max | The maximum value. |
Meter
A meter measures the rate at which something occurs, such as the number of messages sent per second. Users can select the units as well as which of the moving average rates to display.

| Property | Description |
|---|---|
| count | The number of events seen. |
| meanRate | The mean rate, overall. |
| oneMinuteRate | The one-minute moving average rate. |
| fiveMinuteRate | The five-minute moving average rate. |
| fifteenMinuteRate | The fifteen-minute moving average rate. |
Histogram
A histogram measures the statistical distribution of values in a stream of data. Hovering over a quantile reveals the value at that quantile.

| Property | Description |
|---|---|
| count | The number of values or events seen. |
| min | The minimum value (in milliseconds). |
| max | The maximum value (in milliseconds). |
| mean | The mean value (in milliseconds). |
| stdDev | The standard deviation (in milliseconds). |
| median | The median value (in milliseconds). |
Timer
A timer is used to understand both the frequency of and duration of events. It is a combination of a meter (rate of occurrence) and a histogram (distribution of duration). A timer combines the functions and properties of both a meter and a histogram.
Available Metrics
The table below includes all metrics currently available to view on the Metrics Dashboard. New metrics may be made available with the development of new systems, modules, and features.
Metric - authTokenRecords
Metric - changeEventDistributionOperationAccumulator
| Metric | Description | Size | Type |
|---|---|---|---|
| batchProcessDuration | The amount of time that the ChangeEventDistributionOperationAccumulator takes to process a batch. | 4x2 | Timer |
| changeEventDistributions |
| --- | --- |
| changeEventListenersMutations |
| --- | --- |
Metric - changeEventListeners.count
The number of ChangeEvent Listeners registered with the system.
- Size: 1x1
- Type: Gauge
Metric - changeEventPersistenceOperationAccumulator
| Metric | Description | Size | Type |
|---|---|---|---|
| batchProcessDuration | The amount of time that the ChangeEventPersistenceOperationAccumulator takes to process a batch. | 4x2 | Timer |
| batchSize | The number of ChangeEvent Contexts in the ChangeEventPersistenceOperationAccumulator batch. | 1x1 | Gauge |
| dispatchedThroughput | The throughput of ChangeEvent Contexts dispatched to the Execution task for batch processing. | 2x2 | Meter |
| queuedThroughput | The throughput of ChangeEvent Contexts added to the batch. | 2x2 | Meter |
| synchronizerDuration | The amount of time that the File Synchronizer takes to synchronize files with memory. | 4x2 | Timer |
Metric - maintenance
| Metric | Description | Size | Type |
|---|---|---|---|
| cleaner.duration | The amount of time that the Cleaner takes. | 2x4 | Timer |
| pruner.duration | The amount of time that the Pruner takes. | 2x4 | Timer |
| reaper.duration | The amount of time that the Reaper takes. | 2x4 | Timer |
Metric - records.count
The number of AuthTokenRecords in the system.
- Size: 1x1
- Type: Gauge
Metric - touchEventAccumulator
Using the metrics below, you can identify that a system is processing the incoming volume of touch events efficiently if the dispatchedThroughput keeps up with the queuedThroughput minus the collisionThroughput.
| Metric | Description | Size | Type |
|---|---|---|---|
| batchProcessDuration | The amount of time that the TouchEventAccumulator takes to process a batch. | 4x2 | Timer |
| batchSize | The number of touch events in the TouchEventAccumulator batch. | 1x1 | Gauge |
| collisionThroughput | The throughput of touch events added to the batch resulting in a collision. | 2x2 | Meter |
| dispatchedThroughput | The throughput of touch events dispatched to the Execution task for batch processing. | 2x2 | Meter |
| queuedThroughput | The throughput of touch events added to the batch. | 2x2 | Meter |
Metric - ClockDriftDetector
| Metric | Description | Size | Type |
|---|---|---|---|
| driftGauge | The most recent clock drift, in milliseconds. | 1x1 | Gauge |
| driftTimer | A timer that tracks the distribution of the duration of clock drifts. | 4x2 | Timer |
Metric - databases
| Metric | Description | Size | Type |
|---|---|---|---|
connection-{dbName} | Each connected database will have the following associated metrics:
| --- | --- |
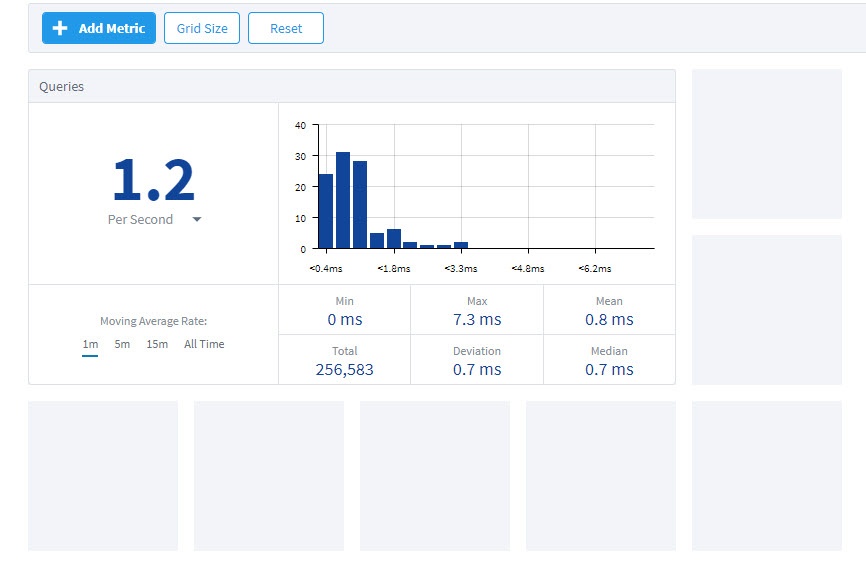
| queries | Measures the rate and distribution of query execution on all database connections. | 4x2 | Timer |
Metric - gateway-network
| Metric | Description | Size | Type |
|---|---|---|---|
| activeMsgCountAll | Total count of all active messages currently being sent over the Gateway Network. | 1x1 | Gauge |
| IncomingBytesSecAll | Accumulation of the number of bytes received per second across all Gateways. | 1x1 | Gauge |
| IncomingMsgsPerSecAll | Accumulation of messages received per second across all Gateways. | 1x1 | Gauge |
| OutgoingBytesSecAll | Accumulation of the number of bytes sent per second to all Gateways. | 1x1 | Gauge |
| OutgoingMsgsPerSecAll | Accumulation of messages sent per second to all Gateways. | 1x1 | Gauge |
| pendingAcksExpired | Indicates how many pending acknowledgements were purged during the last cleanup execution. This metric is relevant for outgoing connections. Note: Some messages create a pending acknowledgement object. When the message is uploaded to another Gateway and that Gateway acknowledges receiving the message, the pending acknowledgement object is cleared. If no acknowledgement is received, these objects can become orphaned. Orphaned pending message acknowledgements are regularly purged. | 1x1 | Gauge |
| pendingMessagesExpired | Records how many messages were purged during the last cleanup execution, giving an estimate of potentially lost messages. This metric is relevant for incoming connections. Messages that were dispatched, but not downloaded by the other Gateway are regularly purged. | 1x1 | Gauge |
| PendingMsgCountAll | Total count of all messages waiting to be sent over the Gateway Network. | 1x1 | Gauge |
| proxyMsgsPerSec | The number of messages per second that are forwarded through this Gateway. Only applies when this Gateway is configured as a proxy Gateway. | 2x2 | Meter |
| services | incomingServiceCalls
| --- | --- |
Metric - ignition
| Metric | Description | Size | Type |
|---|---|---|---|
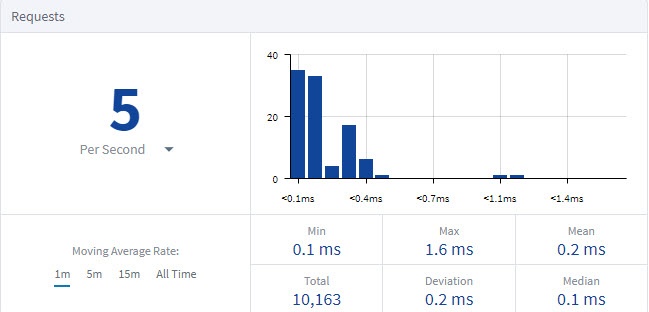
| designer.requests | Measures the rate and distribution of designer requests. | 4x2 | Timer |
| performance |
| --- | --- |
| uptime | Total uptime. | 1x1 | Gauge |
Metric - perspective
| Metric | Description | Size | Type |
|---|---|---|---|
| bindings | Perspective Binding count. | 1x1 | Gauge |
| components | Perspective Components count. | 1x1 | Gauge |
| expressions | Measures the rate and distribution of expressions. | 4x2 | Timer |
| fetches | Measures the rate and distribution of fetches. | 4x2 | Timer |
| pages | Perspective pages count. | 1x1 | Gauge |
| property-changes | Measures the rate of property changes. | 2x2 | Meter |
| scripts | Measures the rate and distribution of script executions | 4x2 | Timer |
session-{sessionName} | Each connected Perspective session will have the following associated metrics:
| --- | --- |
| sessions | Count of active sessions. | 1x1 | Gauge |
| views | Count of views. | 1x1 | Gauge |
Metric - projects
| Metric | Description | Size | Type |
|---|---|---|---|
| (projectName).resources | Count of resources per project. | 1x1 | Gauge |
| count | Count of projects. | 1x1 | Gauge |
| disk-sync | Measures the frequency and duration of projects directory synchronization. | 4x2 | Timer |
| saves | Measures the rate and distribution of project saves. | 4x2 | Timer |
Metric - redundancy
| Metric | Description | Size | Type |
|---|---|---|---|
| config.updateThroughput | Rate of updates. | 2x2 | Meter |
| alarmpipelinemanager |
| --- | --- |
| sync.queue_max | Maximum queue size. | 1x1 | Gauge |
Metric - scripts
| Metric | Description | Size | Type |
|---|---|---|---|
| gateway |
| --- | --- |
| project-(projectName) |
| --- | --- |
Metric - vision.requests
Measures the rate and distribution of Vision requests.
Examples
Adding Metrics to a Dashboard
-
Click Add Metric.
-
Select a metric from the list and click Add.
-
Hover over the grid to position the metric.
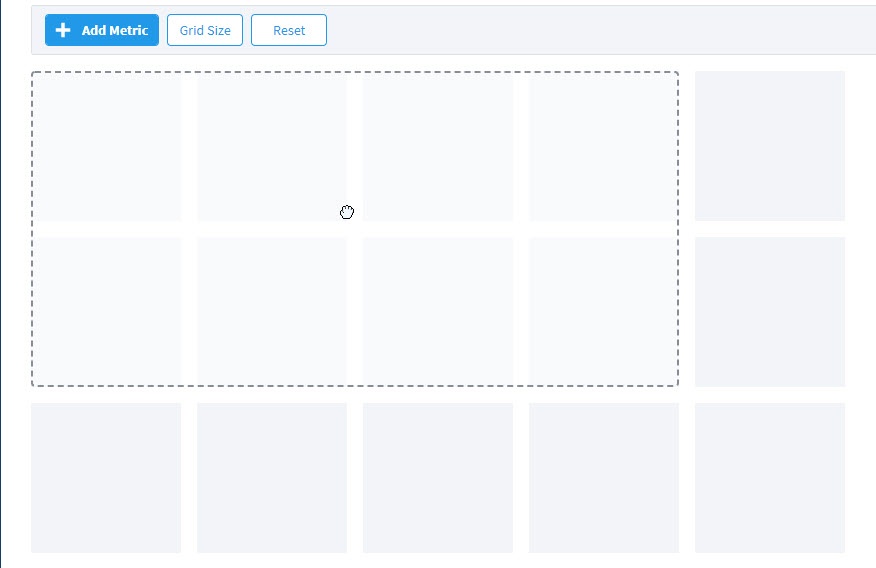
-
Click to snap the metric to the dashboard. To reposition your metric, you can drag and drop it anywhere else on the grid.