Table Rows
Row Types
Rows are an important fundamental aspect of tables. There are three types of table rows: Header, Details, and Summary. The different types of rows can be independently enabled for each level of Grouping, and for each table in a Table Group. Adding or removing the Header, Details, or Summary rows is as simple as selecting the Row boxes in the Configure Table tab of the Property Inspector. A row can also be structured or unstructured. A structured row having a variable number of columns, and unstructured row having no columns so you can add images, charts, data, and text shapes anywhere in the row. Additionally, Table Row Versioning gives you the option of conditionally displaying rows with a different format to make them stand out.
To learn more about Tables, go to Report Tables and Table in the Appendix.
Header Row
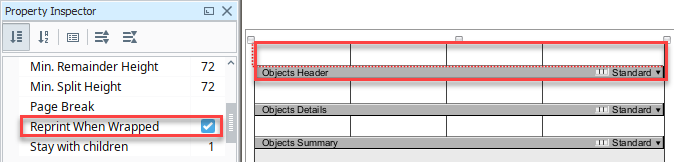
The Header Row allows for a single row to be placed before the Details rows. This is commonly used to create a header for the Table. An interesting feature of the header row is the Reprint When Wrapped property which allows the header row to be reprinted on a new page when its data crosses a page boundary. To disable this feature, uncheck the Reprint When Wrapped property in the Properties tab of the Property Inspector.
Automatic Text Resizing
If text in a Header Row is so long that it will result in truncation or overflow, the size of the text will automatically resize to accommodate.
Detail Rows
The Detail Rows typically represent the majority of the data on a table or commonly referred to as the "middle" rows. Once you configure the Detail rows with your datasource, the table displays your data in a structured, repetitious format. You can customize the layout and organize the data to determine how you want your data to look on the report. You can even disable Detail Rows in unusual situations such as only displaying aggregate summaries.

Summary Row
The Summary Row is like the Header row only it prints at the bottom of the table, and is typically used to display aggregates for keys. They are typically used in conjunction with some of the Show Calculation keys, such as count, total, running total, etc.
Configuring Header, Details, and Summary Rows
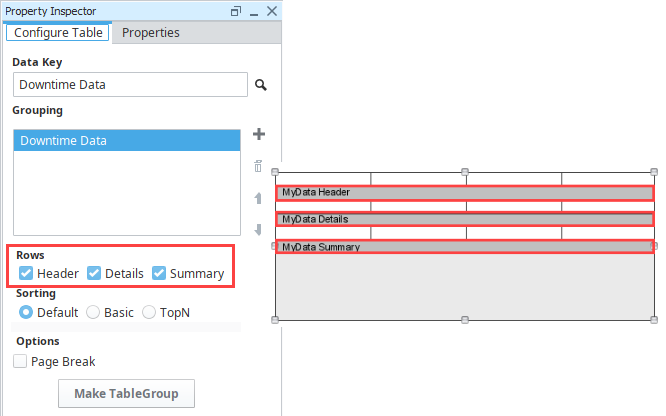
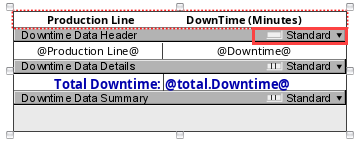
Once a Table component is in your Design Panel and your Datasource is populated in the Data Key field, check the Header and Summary boxes. The Header, Details, and Summary rows will be added to your report. The Details box will be checked by default. To remove the Header, Details, or Summary rows, uncheck the applicable rows.
Structured vs Unstructured Rows
Structured Rows behave like a row in a spreadsheet: a series of columns are horizontally adjacent to each other. In the case of a row, the columns are Text Shapes. A structured row can have a variable number of Text Shapes. Structured rows provide more control over the layout, wrapping, and organization of text based table data. Since structured rows only allow for Text Shapes, they can not contain components like images, barcodes, charts, and text shapes.
To view the properties of the Details row (or any row), super-select the row by clicking on the Details row (dark bar in the table), or clicking the Details node in the Project Browser tree. You can confirm that a row is structured by looking at the Structured Columns property in the Properties tab of the Property Inspector, or by looking at the Row Structure icon ![]() next to the Standard row version label. You can also change the number of columns in a row, using the Column Count property.
next to the Standard row version label. You can also change the number of columns in a row, using the Column Count property.
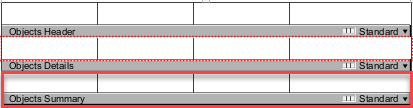
You can tell when a row (any row) is selected by looking at the Project Browser tree, or by looking at the red outline of the rows in a table. A row's content is above its respective dark row bar.
Unstructured Rows are functionally very similar to structured rows, but they do not offer the same column based text constraints. Instead, Unstructured Rows allow you to place any other report component inside of the row. Unstructured rows are highly customizable rows allowing you to place data, text shapes, images, or charts anywhere you want them within the row.
There are two ways to make a row unstructured once your row is selected:
- In the Properties tab of the Property Inspector, set the Structured Columns property to 'false'.
- In your Table, click on the Row Structure icon
 on the right side of you row. Click the icon to make the row unstructured
  . You can toggle the Row Structure icon to switch between a structured row and unstructured row.
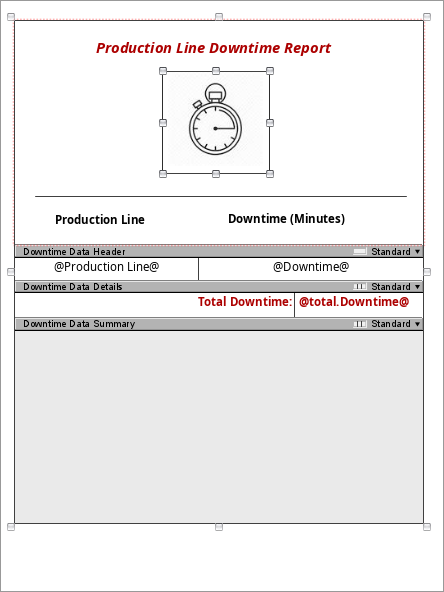
Now that the Header row is unstructured, drag the Header row down the page making room to add any component(s) from the Report Design Palette, and place it anywhere in the row. For example, you can add a Text Shape to the report title and a Line Shape to separate the image from the report data.
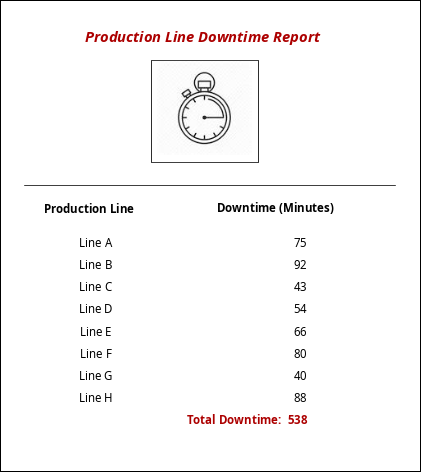
Always be sure to verify your report appearance using the Preview panel.
Report Data Configuration
In addition to configuring rows, you can also configure how you want your data to appear in a report using the Sort and Filter functions in the Table component.
Sorting
Sorting orders your data by a single data key or list of data keys. There are three types of Sorting in Tables.
- Default - data is sorted based on the order in which it is retrieved.
- Basic - takes a list of data keys and sorts by the first one. If the sort results in a tie, the tie will be resolved by the next data key in the list, and so on.
- TopN - uses a single key path, with a Count value that allows a limit to the number of rows that are processed.
Basic and TopN sorts can be configured for either ascending (![]() ) or descending (
) or descending (![]() ) sorts. They can also utilize aggregate (calculation) keys.
The TopN sort option, Include Others
) sorts. They can also utilize aggregate (calculation) keys.
The TopN sort option, Include Others ![]() if selected, will include all values outside of the specified Count range by compressing them into a single row.
if selected, will include all values outside of the specified Count range by compressing them into a single row.
Sort and Filter Examples
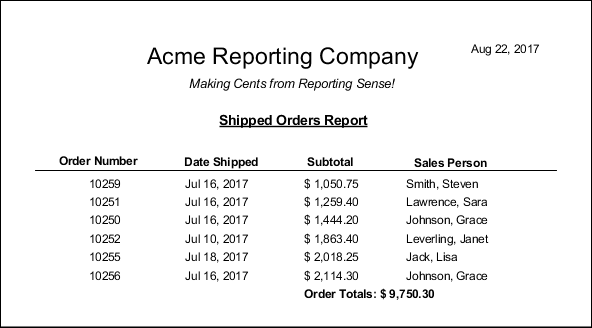
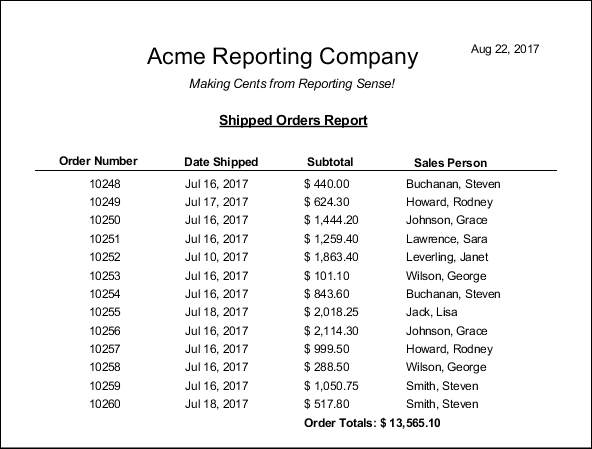
The CSV dataset containing all the data and the table used for the following Sort and Filter examples are shown below.
Dataset
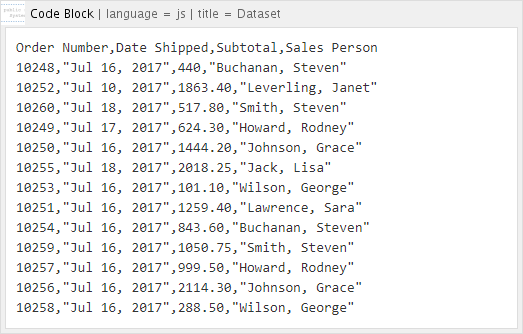
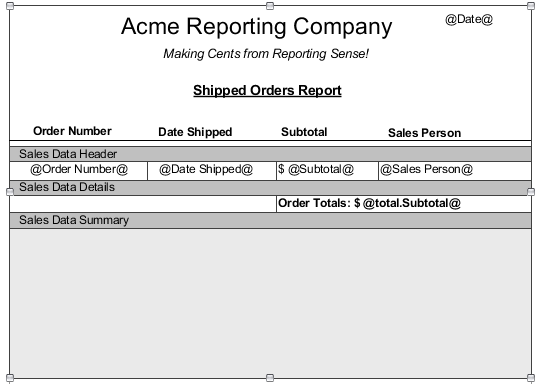
Table in the Design Panel
Default Sort Example
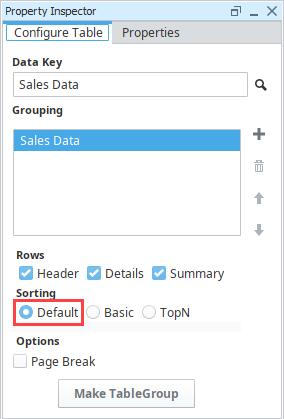
The data for the Default sort is retrieved directly as-is from the dataset. No sort order is applied.
Configure Table
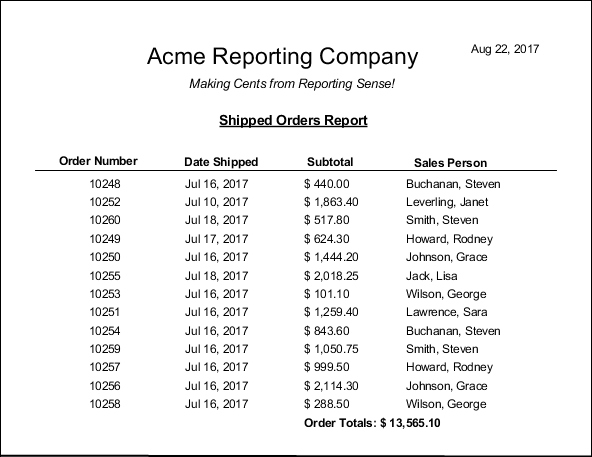
Default Sort Results
Basic Sort Example
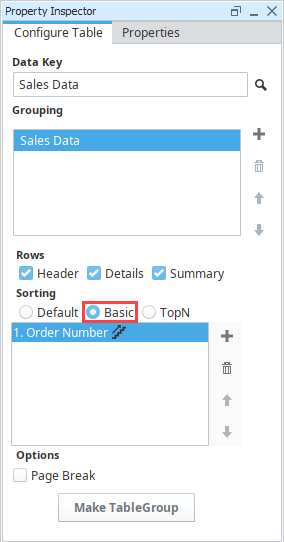
The Basic sorting type allows you to sort the table by ascending or descending order for any of your data keys. You can do this by selecting the Add icon after Basic is selected and choosing the data key, such as Order Number, you want to use for sorting. Then, right-click to confirm sorting preference by selecting Sort Descending or Sort Ascending. Ascending is the default sort option.
Configure Table
Basic Sort Results
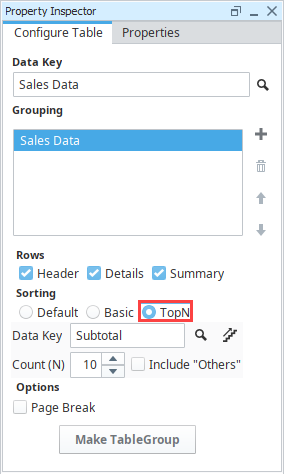
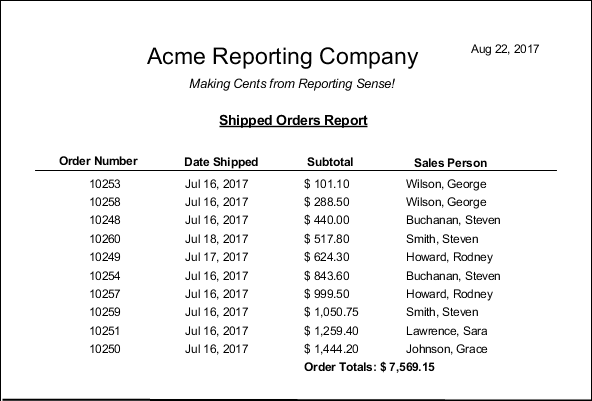
TopN Sort Example
This table was sorted by the Subtotal data key in ascending order with a Count value of 10 rows. To sort in decending order, click the Ascending icon ![]() next to the Data Key to switch to Sort Descending as needed. Then, use the Count (N) arrows or manually enter the amount of rows you want visible. Selecting the Include "Others" checkbox will add an additional "Others" row to summarize all rows not included in the TopN results.
next to the Data Key to switch to Sort Descending as needed. Then, use the Count (N) arrows or manually enter the amount of rows you want visible. Selecting the Include "Others" checkbox will add an additional "Others" row to summarize all rows not included in the TopN results.
Configure Table
TopN Sort Results
Filtering
Filtering gives the option of processing data based on an expression. The Filter Key property can be found in the Property Inspector under the Properties tab of the Property Inspector.
Once you enter your expression in the Filter Key field, hit return to commit your expression. If the expression resolves to 'false', the row will be skipped.
Filtering Example
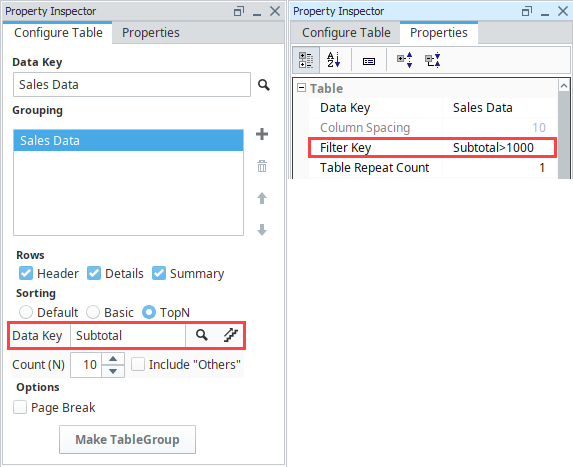
For example, if we use the Subtotal Data Key from the previous example, we can navigate to the Properties tab of the Property Inspector and enter Subtotal>1000 into the Filter Key field to only display Subtotal values greater than 1000 in our table. You can still toggle between ascending and descending order for your table using the Ascending icon (![]() ) after filtering.
) after filtering.
Configure Table and Property Tab of the Property Inspector
Filtering Results