Data Keys
In the Reporting Module, we use Data Keys to pull values from data sources and show them on the report. In simple terms, Data Keys are placeholders for your data. The simplest reference to data is a simple Data Key. At report generation time, these keys resolve to the values (or sets of values) provided by the data source. Additionally, Data Keys may be used as expressions, which are referred to Keychain Expressions.
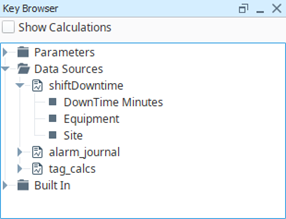
As you add Parameters and Data Sources to the Data section of your report, they will appear in the Key Browser's Parameters and Datasources folders.
Data Keys on the Report
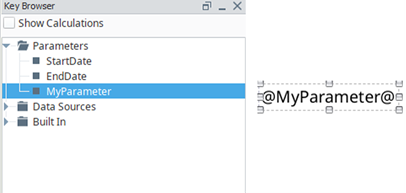
Data Keys are enclosed in the "@" character when utilized by components in the report. They may be typed manually, or dragged directly from the Key Browser.
Keys that contain a single value will create a Text Shape when dragged onto the report.
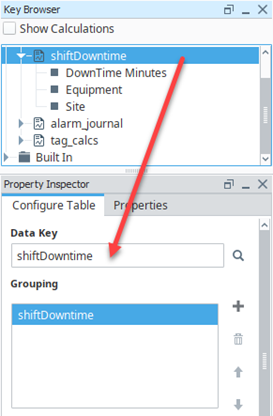
Keys that represent datasets will create a Table component, and configure the Data Key property to use the key. Additionally, you will need to manually set the column in the table with the Data Key to display the datasets.
Escaping the @ Character
In some cases, your report may need to contain multiple strings containing the "@" character. Since these characters are used to denote keys, multiple instances of these characters may lead to undesirable behavior. You can escape this key lookup with "@@". For example, if a Text Shape needed to contain multiple email addresses, they could be typed in the following way:
user1@@company.com
user2@@company.com
When the report generates, the double "@@" characters will be replaced with a single "@" character.
Built-In Keys
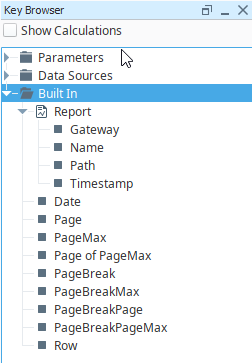
Built-In Keys provide a lot of useful information on your report at a glance. The Built-In keys are found in the Key Browser. Expand the Built-In folder and you'll see all the default keys, including a Report folder. The keys in the Report folder are specifically related to the report: Gateway name that the report is located in, report name, folder path from the Project Browser to the report, and the Timestamp of the Gateway. The other Data Keys are related to information you may want to add to a report like the date you are viewing or printing the report, page number, and number of total pages.
Built-In Data Key Description
The table below show the Built-In Report Data Keys and Built-in Data Keys along with a brief description of each key.
| Key | Description |
|---|---|
| Report | The key has multiple sub-keys that provide meta-data about the report.
|
| Date | The current date/time |
| Page | The current page |
| PageMax | The total number of pages in the generated report |
| Page of PageMax | Shows current page number and the total number of pages in the report |
| PageBreak | The number of explicit page breaks encountered |
| PageBreakMax | The total number of explicit page breaks in generated report |
| PageBreakPage | The number of pages since last explicit page break |
| PageBreakPageMax | The total number of pages in current explicit page break |
| Row | Shows the current row number. Must be used in a table |
Show Calculations Property
In the Key Browser, the Show Calculations property will add several aggregates to each key. These allow your reports to easily display things like the total of a key. These calculations are typically used in the summary row on the Table component.
Once Show Calculations is enabled, the Key Browser will refresh, and each key will be expandable. Expanding a key will show the available calculations. For example:
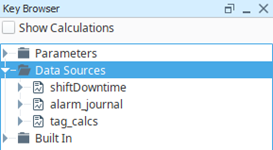
When Show Calculations is disabled, the key browser only lists the shiftDowntime, alarm_journal, and tag_calcs Data Source keys.
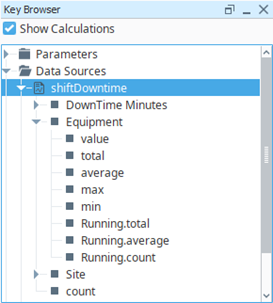
When Show Calculations is enabled, the column of data in shiftDowntime, alarm_journal, and tag_calcs Data Sources are expandable and show available calculations like value, total, average, max, min, Running.total, Running.average, and Running.count.
Calculation Keys work like any other key, so they can be dragged onto the report and utilized in Keychain Expressions. They can also be entered manually, even if the key doesn't appear in the Data Key tree. For instance, if you are using Nested Queries, you can simply type @total.NestedQueryKey@ in the Report Design to get that calculated value to appear.
Dynamic Data Keys
Normally, Data Keys are used to display the value of a key, such as the Text property on a Text Shape component. However, when modifying other properties on a report component, you can use Dynamic Data Keys instead.
Dynamic Data Keys allow you to use the value of a Data Key on a non-string property. With Dynamic Data Keys, you can modify properties on report components, such as the background color or width, based on the value of a key. This is very similar to the binding system used by components in the Vision Module.
Configuring a Dynamic Data Key
There are two ways to configure a dynamic data key. Note that the syntax of keys differs in Dynamic Data Keys: the "@" are omitted, as demonstrated below.
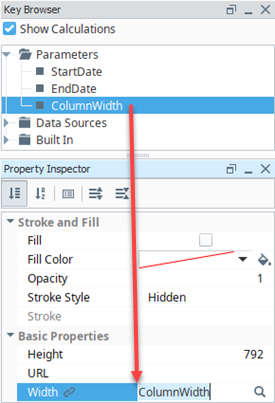
Drag-and-Drop
The easiest approach is by simply dragging a data key from the Key Browser directly to a property on a report component.
Right-Click
-
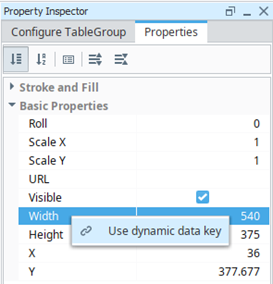
With a report component selected, look in the Property Inspector, and left click on the name of a property you wish to place the dynamic data key on.
-
Once selected, you can right-click on the property name and a menu will appear.
-
Click on the Use dynamic data key menu item.
-
This will place a dynamic data key on the property. An icon of a link
 will appear next to the property name, and a default key will be applied to the property.
 -
Next we will want to override the default value with one of the keys from the Key Browser. Simply left click on the value field and a magnifying glass
 icon will appear.
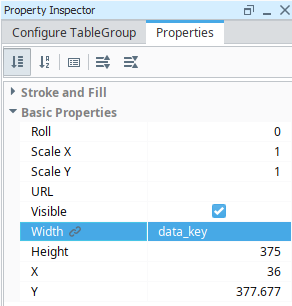
-
Click on the magnifying glass
icon. From here a popup of available keys will appear. Select the key you wish to use, and then click OK.
Removing the dynamic data key binding
With a report property selected, you can right click on the the selected property and click on Use static value menu item to remove the binding.

Data Key Usage
Data Keys as Paths
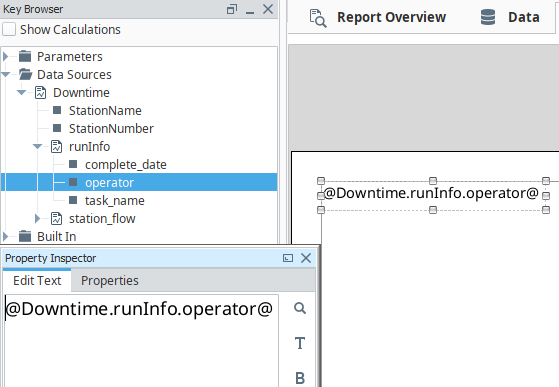
Data Keys are relative, and use dot notation to reference children. So if we have a nested data structure, we can use Data Key paths (also known as Keychains) to reference the nested data. In the Key Browser image below, we have a nested data source called Downtime. Downtime contains a number of columns, and then contains a reference to additional data called runInfo. If we wanted to access the highlighted operator data, we could use the keychain dot notation in the Designer: @Downtime.runInfo.operator@. It's important to note that dot notation functions differently in tables because the parent datakey is already applied to the entire table.
You can learn about Data Source nesting in the Nested Queries section.
Array Index of Data
You can reference an individual object in a list using standard array indexing syntax (brackets) like this: @dataSource[0].columnName@, where "dataSource" is a data source that contains a child data key named columnName. Assuming a data source with the values listed below, we can retrieve the value of "Second Row" by specifying index 1 and the column stringValue: @static_data[1].stringValue@
indexColumn, stringValue
0, "First Row"
1, "Second Row"
2, "Third Row"
4, "Fourth Row"
| Design | Preview |
|---|---|
 |  |
Colors in Expressions
Colors can be used on a report component in several ways.
Colors in Hexadecimal
First, hexadecimal case-insensitive color codes may be used. The code must be wrapped in quotation marks to be evaluated correctly. Note that the color change will only appear when the report is executed. The easiest way to test the expression is to switch to the Preview Panel.
Below we see a Blue hexadecimal code of "0000FF" is used on the Fill Color of a Rectangle. The Fill Color on the Rectangle was originally set to White. Because the expression will not evaluate in the Design Panel, the Rectangle will appear as a White color.
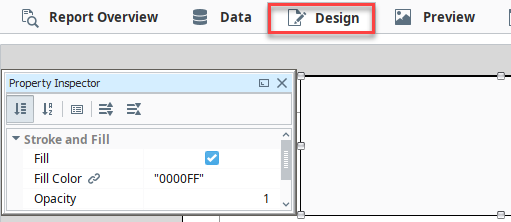
However, switching over to the Preview Panel will generate the report, and evaluate the expression. This in turn returns a Blue Fill Color.

The 7th and 8th digits may be added to specify an alpha channel, or the opacity of the color: 00 is fully transparent, while FF is fully opaque. Below, we see a similar rectangle overlapping an ellipse, but with a code of "0000FF40". This represents ~25% opacity, so objects behind the rectangle will be visible, and the fill color will only be slightly opaque.

Parameters as Colors
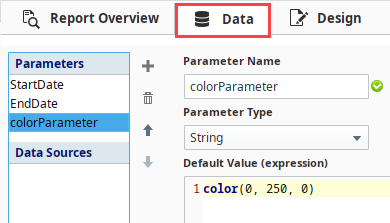
You may also leverage Report Parameters to specify colors. This typically involves creating a parameter with a string datatype, and using the color expression function. Once created, you can simply create a dynamic data key reference on the property by dragging the parameter from the Key Browser onto the property in the Property Inspector. This way, you can have several components use the same color, and modify the color in a single location.
| Data Panel | Key Browser |
|---|---|
 | 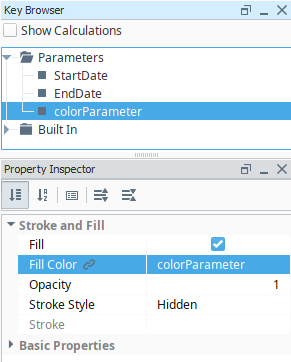 |
Strings as Colors
Additionally, case-insensitive string color names may be used to return a color. Again, the value must be wrapped in quotation marks.

String Value Color Reference
The following string values may be used:
| Value | Example | Value | Example | Value | Example | Value | Example | Value | Example |
|---|---|---|---|---|---|---|---|---|---|
| "beige" |
| "gold" |
| "lavender" |
| "pink" |
| "tan" |
|
| "black" |
| "goldenRod" |
| "lightGray" |
| "plum" |
| "teal" |
|
| "blue" |
| "gray" |
| "lime" |
| "powderBlue" |
| "violet" |
|
| "brown" |
| "green" |
| "magenta" |
| "purple" |
| "white" |
|
| "crimson" |
| "hotPink" |
| "maroon" |
| "salmon" |
| "yellow" |
|
| "cyan" |
| "indigo" |
| "navy" |
| "silver" |
| "clear" | Zero opacity. Similar to disabling the Fill property. |
| "darkGray" |
| "ivory" |
| "olive" |
| "skyBlue" |
| ||
| "fuchsia" |
| "khaki" |
| "orange" |
| "red" |
|