Optimize Gateway Network Performance
Gateway Network Services
The Gateway Network is an Ignition to Ignition communication network, allowing you to connect multiple Ignition Gateways together. Although licensing is unlimited, the limitations on hardware can cause performance problems. This is where splitting modules onto separate Ignition servers or reconfiguring an existing architecture becomes helpful or even necessary to better connect sites, share and aggregate data, increase visibility, and centralize management.
Separating out functionality not only improves performance, but can also increase security and simplify scaling out systems in the future. Splitting servers between Back-End and Front-End is a common way to dedicate servers to separate functionality where the Back-End may contain the drivers to the PLC, the tag historian, and alarm notification, but the Front-End handles applications.
See the Scale Out Architecture User Manual page for more information on scaling out a system.
System Baseline
Since the services included in the Gateway Network work to distribute features and load, fully utilizing the Gateway Network resources allows you to better detect and eliminate bottlenecks in your system if you understand your connection baseline. Everything you need to monitor your system baseline is on the Gateway Network status page where you’ll find queue statistics and throughput information. Use this information to anticipate how changes will affect memory and performance and give you a head start on adjusting your system settings as you build out and grow your system.
You should also familiarize yourself with the remote services you have active and what settings are adjustable. Remote services like tags, tag history, and alarm history should be frequently checked to make sure each service is maximizing its performance potential.
Alone, these settings won’t make or break your system performance, but they all stack up, especially in larger systems, and give you many courses of action for optimization. It is important to check all servers in the network to understand throughput and load throughout.
Remote Tag History
Remote tag history is possible through the remote tag provider or through a remote tag history provider. Both options query through the Gateway Network, but use different tag paths. Remote tag providers use realtime tag paths and remote tag history providers use historical tag paths.
Remote Tag Providers connect to a remote installation of Ignition and access tags, making remote tags a local representation of tags that exist on the remote system. By default, providers are set to read only, but can be changed to read and write in order to continue preserving memory, without limiting control. Remote tag history sends historical data to another server to be stored, such as a corporate database. Remote tag history functionality extends to querying historical data as well.
Two aspects to check in your tag history query process are whether you’re using fully qualified historical tag paths and querying history directly against an SQL database for maximum performance. Since tag history can be queried from multiple sources, it’s important to be aware of where tag history is queried from. Tag history queries can be slow, which may increase load on the receiving side and cause bottlenecks on the Gateway Network. Since Historical tags use fully qualified historical tag paths, they display provider information. However, realtime tags do not specify which tag history provider to query from, and therefore may be querying through the Gateway Network without your control.
You can check provider information displayed on the Config > Tags > History page to confirm the provider Type and make sure you’re querying through your desired location.

The above image also shows there is an option to incorporate a splitter, which allows you to create a database to mirror data so that it can be queried locally. Using a splitter means the data is available on both sides. This enables a faster response time and eliminates a potential need to control who has access on either side. For instance, you will not need to worry about users on a corporate server putting additional load on the Network outside of standard operation needs.
If you are querying through realtime tag providers, make sure your History Settings have Database selected as the History Access Mode.
Remote Tag Provider Alarm Subscription
Remote tags are a very efficient service by default, but can be more useful if you adjust the Alarm Mode for systems split between Back-End and Front-End servers. Alarms should already be visible on the Back-End and are queried by default. Selecting Subscribed for the Alarm Mode pushes alarm notifications immediately on the Front-End server.

This is a manual selection because depending on the amount of alarms, it could cause a delay due to the higher memory use. You must first determine whether subscription benefits outweigh the added load on the Gateway Network. Although the delay will be relatively short, it may cause confusion to an operator or other Front-End user.
Enterprise Administration Module (EAM)
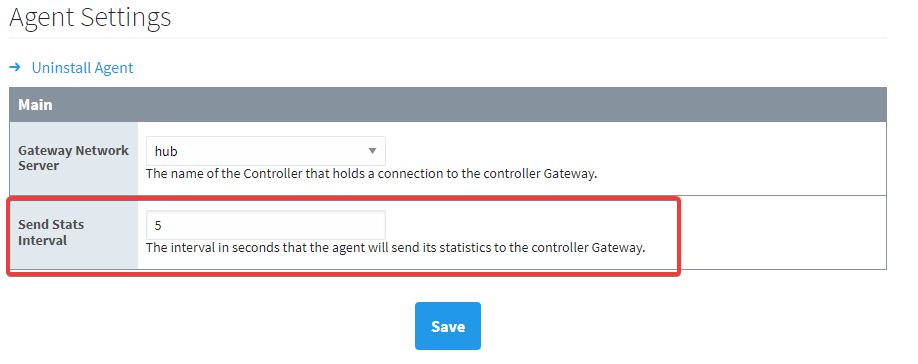
All agents configured to the central EAM controller send diagnostic data based on a set interval. If you have a high number of servers in your Gateway Network, you’ll have a high throughput of requests. To counteract this, you can lower the interval to better control queues and optimize overall function. This interval can be modified in the Agent Settings by accessing the agent under the Config section on the Gateway Webpage and selecting Enterprise Administration > Agent Settings. Here you can adjust the Send Stats Interval to a lower number to send statistics less often.
Queue Management
A great way to understand your system’s data flow is to closely review your Gateway Network Status page, checking queues and thread pools. Queue statuses can illuminate issues with large numbers of alarms or tag history queries you might not be expecting to see. Maxed out thread pools or a high number of active and pending requests in the queues can unnecessarily slow performance.
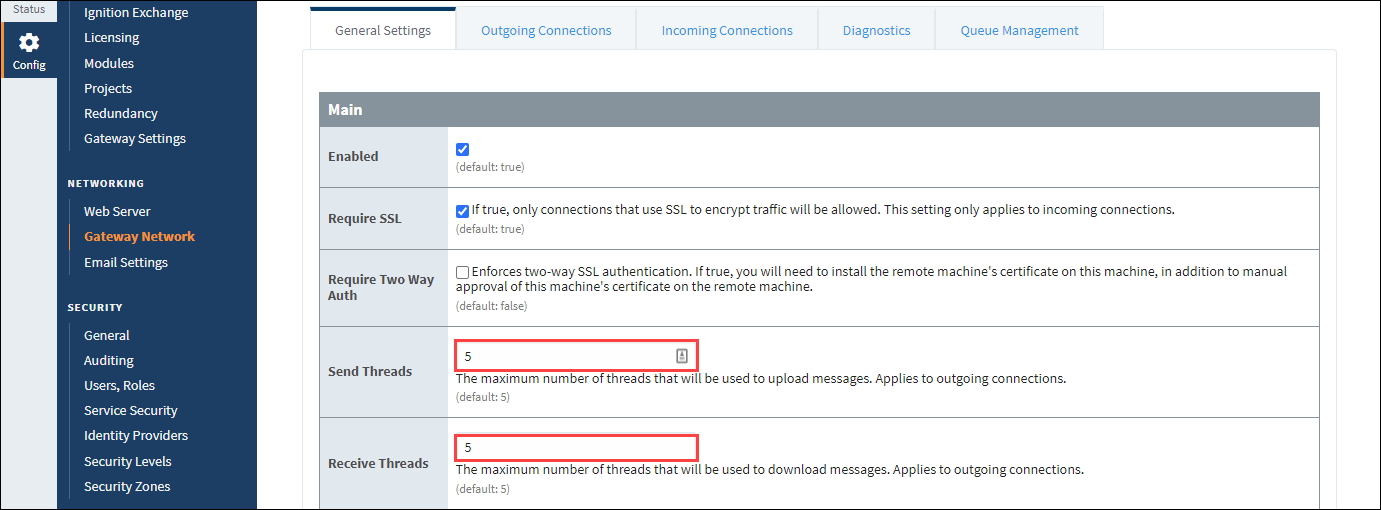
Once a thread pool maximum number of requests is reached, the local server will be unable to respond to anything else until those are processed. By default, thread pools have a limit of 5 requests. The maximum limit can be adjusted for different workloads in the Send Threads and Receive Threads settings under Config > Network > Gateway Network Settings > General Settings. Although you don’t want infinite threads, which can cause a crash, you can raise or lower this limit to clean up your system. For example, if there are a lot of expected requests for tag history, increasing the limit will reduce issues the local server may experience.
Also, if you are querying tag history though the Gateway Network, adjusting the Max Active number in the Queue Settings may help avoid bottlenecks or system shutdowns. Navigate to Config > Network > Gateway Network Settings and select the Queue Management tab to change the Max Active amount from unlimited to a number that best suits your system.
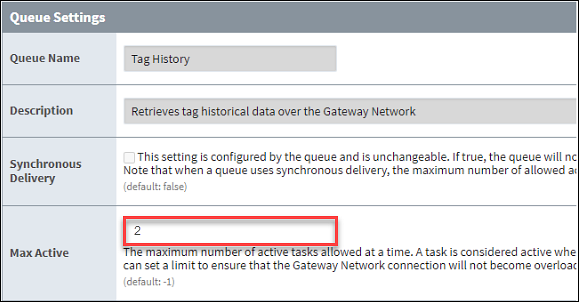
Note this may cause errors on the Front-End in the same way as the maximum limit in a thread pool prevents the local system from processing other requests, reaching the Max Active task limit will appear as an error.
Ping Rate and Latency
The Gateway Network continuously sends ping messages to monitor connection health. Ignition settings allow monitoring of ping response times for both outgoing and incoming connections. The Diagnostics tab on the Gateway Network page can be used to test remote server response times on both sides to help identify potential latency issues. Slow responses may indicate the need for tuning, as servers can perform poorly due to high latency, maxed-out threads, or high request loads.
When multiple consecutive pings time out, the connection is marked as faulted, which may indicate a server issue. Persistent faulting causes the connection to automatically close and reopen, which can degrade performance due to repeated reconnections, particularly in large networks. Adjusting ping rates on the Gateway Network Settings page can stabilize the system. For example, consider setting the Incoming Ping Rate to 10 seconds, and adjust the Outgoing Ping Rate to twice that (20 seconds). Adjusting the Ping Timeout, to 1–2 minutes for example, may help manage intermittent connection issues while allowing timely fault detection.
In addition to ping monitoring, idle requests will appear on the Stats page, showing details about service enumeration, subscription validation, and incoming and outgoing data bytes. Observing this data can help identify bottlenecks or unusual patterns that may signal underlying network issues requiring immediate troubleshooting.
Secure Connections
Proxy Nodes
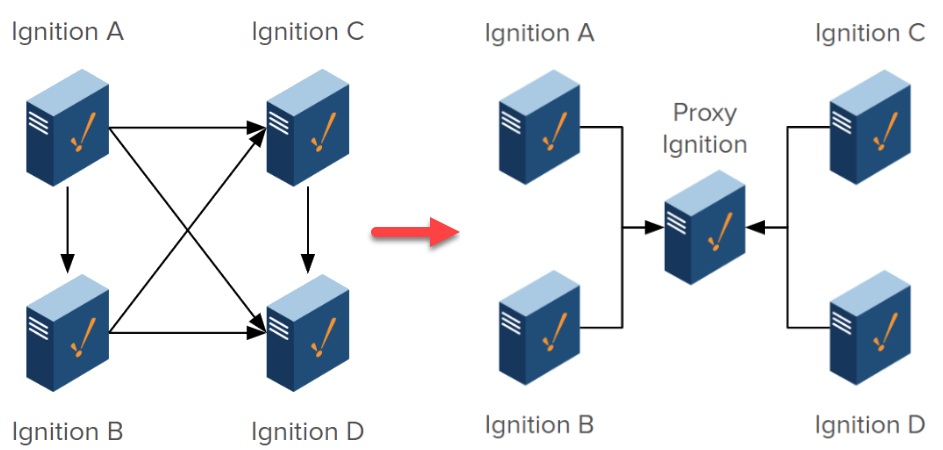
Depending on what you want for your architecture, the use of proxy nodes may be essential. Proxy nodes make architecture simpler by removing complexity in connections and avoiding busy connection paths. Proxy nodes are most effective in highly segmented networks. For instance, when working with an Operations network and a Business network that are unable to talk directly, you can create a proxy Ignition server as a middle layer. There is no configuration required beyond outbound connections from the sites to the proxy server to allow data transfer between them.
Placing Ignition as a proxy to take advantage of the Gateway Network features in this way also strengthens security since simpler networks require less firewalls to maintain. In the example below, the use of a proxy server eliminates many unnecessary connections to increase stability.
Connection Security
Although direction does not matter for Ignition, be mindful of IT practices. It is recommended to connect on one side only and connect upwards. Using the fewest connections possible helps IT lockdown and secure connections. Let’s consider the example of connecting a local Ignition outgoing connection to a central Ignition platform. This single connection will still be bidirectional, but setting up in this way prevents exposing the OT network to inbound connections and requires just one port to be open in a firewall. Also, Ignition can handle further communication through a mesh network as needed.
You can also use whitelists to limit incoming connections. Doing so ensures the proxy only accepts requests to pass through to the Gateway if they originate from an approved server. Note that using whitelists on a proxy still requires approving each individual server even if you previously accepted a root CA certificate for the servers, as the approvals fulfill separate purposes.
Service Security
Service Security defines the security policies established at the source for what data is accessible. It can define if a specific service is available at all, read-only, read-write, and so forth regardless of connection direction. Zero-trust is not the default security policy, but it should be highly considered since being strict about security is the best way to control the flow of data. A zero-trust policy will reject all unwanted requests. To update your Default policy to zero-trust, navigate to Security > Service Security and select Edit. Use the dropdown on each Alarm section to select Deny.
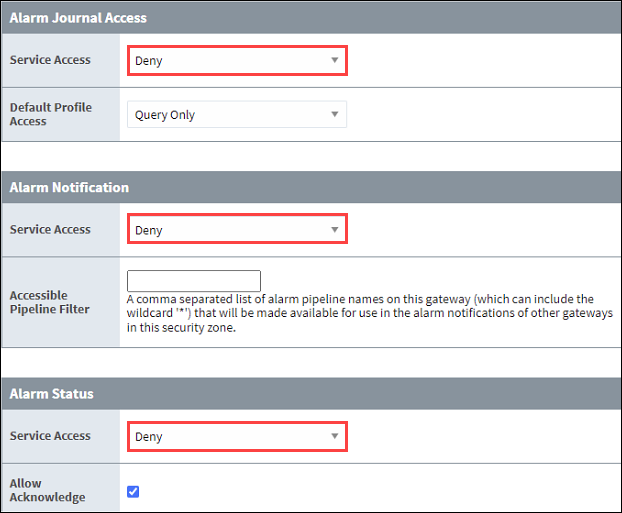
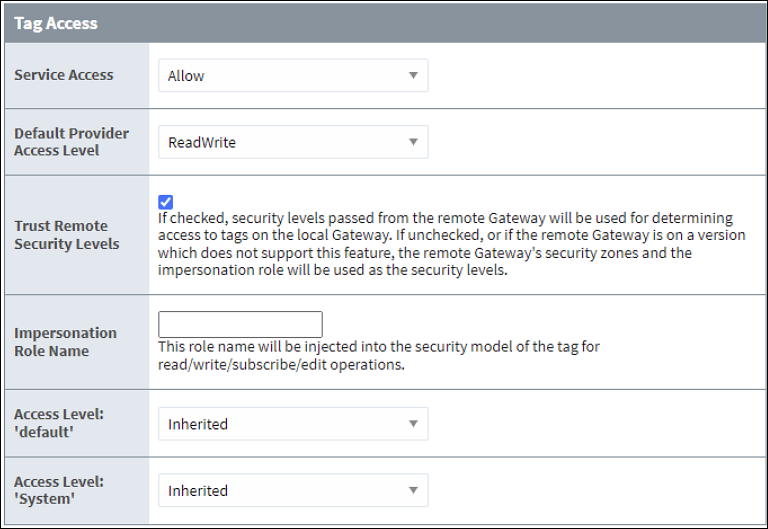
Now, you can define new security zones and edit zone-based settings as needed for your system to allow wanted requests. See the Tag Access image below for an example.
- Navigate to Security > Security Zones and select Create new Security Zone.
- Enter a zone name and fill in any of the three Identifier fields to add services to the zone.
- Return to the Service Security page.
- Edit your policy settings to choose what fields you want to enable and how.
