Audit Log Displays
This page documents several ways to view results from the Audit Log System. For more information on how the Audit Log works, see the Audit Log and Profiles page.
Access the Audit Log with Table Functions
Vision
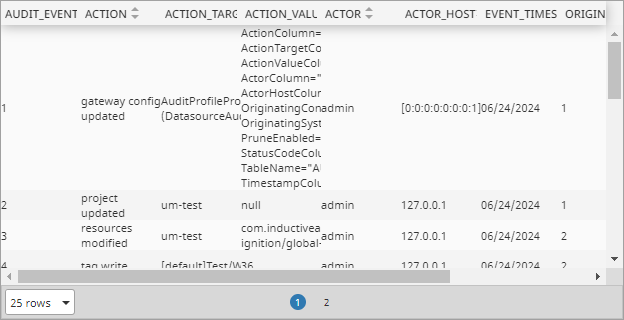
In Vision, you can easily access and display the audit log using table functions.
-
Ensure you have an Audit Log set up and attached to a project.
-
Open the Designer and navigate to your Vision project.
-
Drag a Table component onto a window.
-
In the Property Editor, click the binding icon for the table's Data property. The Property Binding window will appear.
-
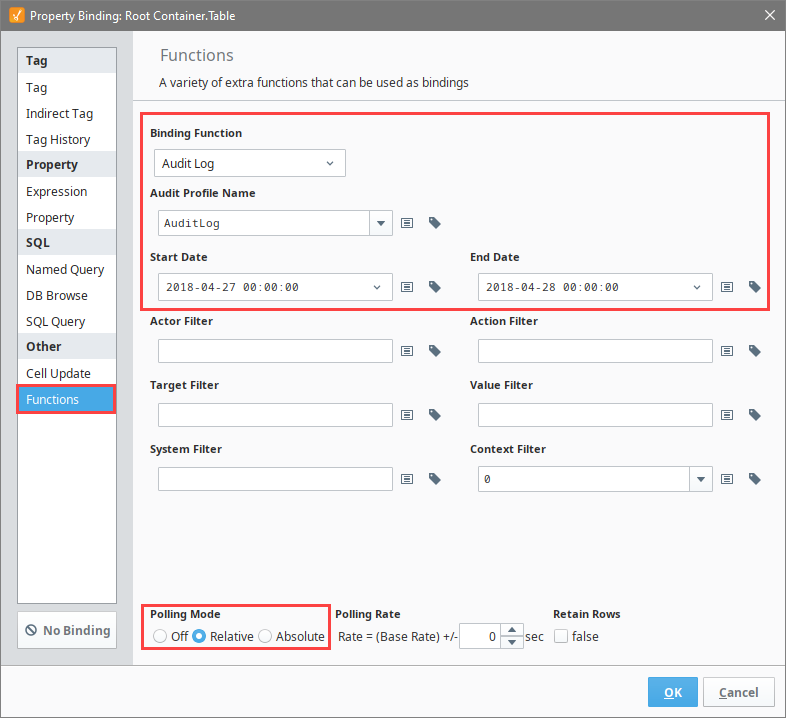
Select the Functions binding type and choose Audit Log from the Binding Function drop-down menu.
-
Configure the binding options:
- Audit Profile Name: Select your Audit Profile.
- Start Date: Enter the appropriate start date.
- End Date: Enter the appropriate end date.
- Polling Mode: Select Relative.
-
Click OK to apply the binding. The Table will populate with the audit log data based on the selected parameters.
-
Use the Table Customizer to configure the Table's appearance by reorganizing and hiding columns, making columns sortable, and assigning meaningful headers.

Perspective
Currently, Perspective does not have an automatic way to query the audit log. Instead, you can use a Named Query or the system.util.queryAuditLog function to display audit log data.
Using a Named Query
To display audit log data using a Named Query:
-
Create the Named Query:
-
In the Designer, navigate to Project > Named Queries.
-
Create a new query named
AuditLogQuery. -
Select the Database Connection that contains the audit log data and enter the following SQL query:
SELECT * FROM audit_events
WHERE event_timestamp BETWEEN :startDate AND :endDate
ORDER BY event_timestamp DESC -
Add parameters
startDateandendDatewith the Data Type DateTime.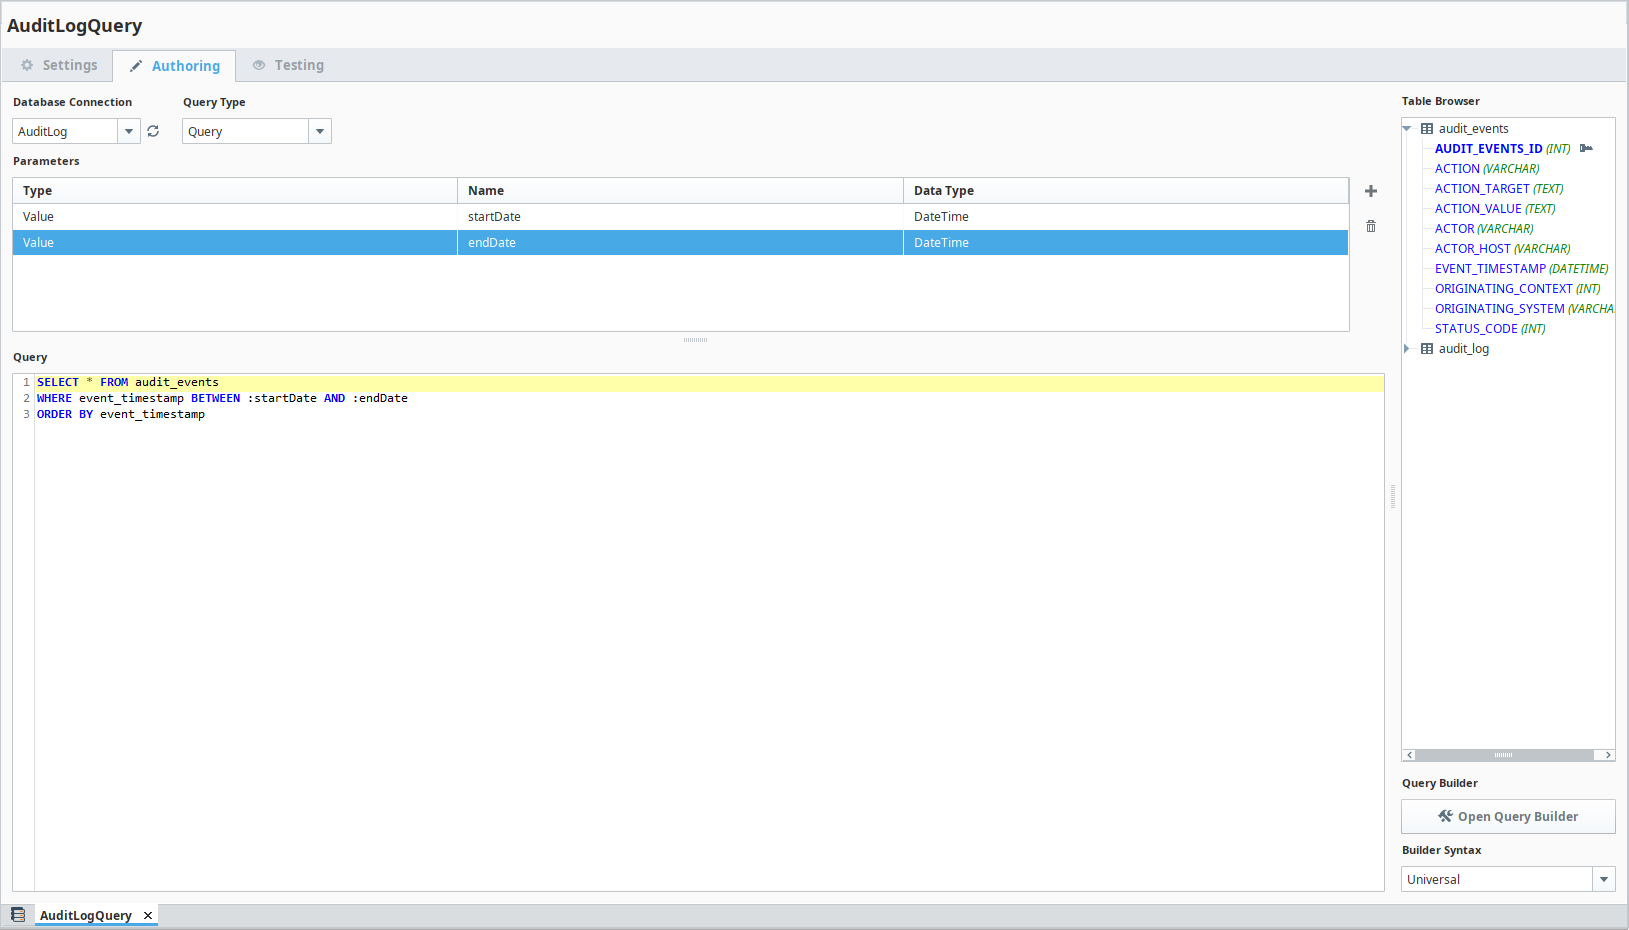
-
-
Bind the Named Query to a Table:
-
In a Perspective View, drag a Table component onto the canvas.
-
Select the Table component and go to the Props section.
-
Bind the data property to the Named Query you created.
-
Configure the parameters
startDateandendDateto specify the date range for the query.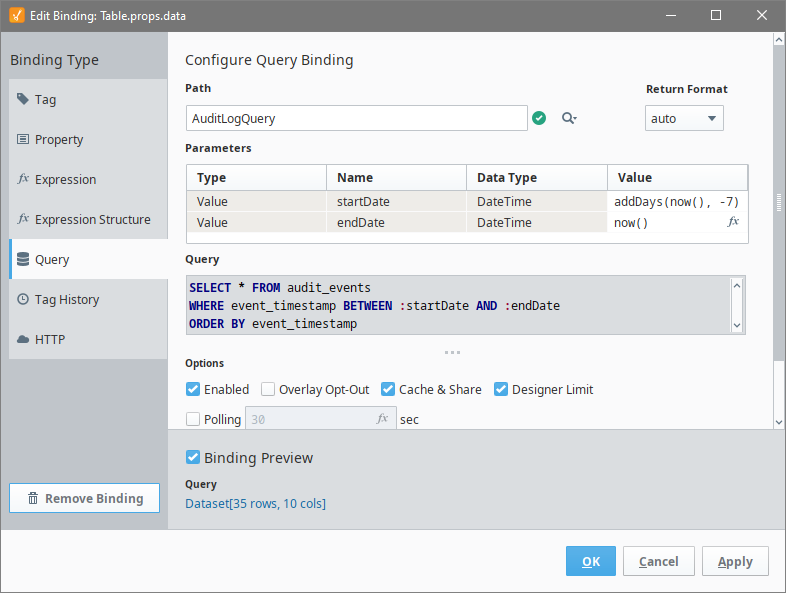
-
-
Customize the Table columns to display the data correctly. This may include formatting dates and adjusting column headers.
-
Save your changes and launch the Perspective session.
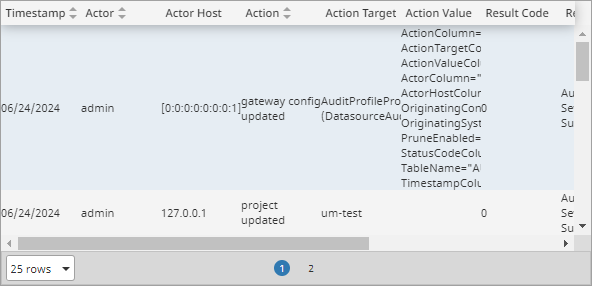
The Table component will now display the audit log data for the specified date range.
For more details, see Named Queries.
Using system.util.queryAuditLog
To display audit log data using the system.util.queryAuditLog function:
-
In the Designer, drag a Table component onto a new View. Name it auditLogTable for the script example below to work.
-
Right-click on the root container of the View and select Configure Events....
-
In the editor, select the appropriate event (e.g., onStartup).
-
Click the
 and select Script.Example Script
# Define the start date and end date for the query
today = system.date.now()
startDate = system.date.addDays(today, -7)  # Example: last 7 days
endDate = today

# Query the audit log using the specified date range
results = system.util.queryAuditLog("AuditLog", startDate, endDate)

# Set the data property of the Table component with the results
self.getChild("auditLogTable").props.data = results -
The Table component can take the raw output of the
system.util.queryAuditLogfunction. However, you will need to configure the columns in the Table's props to display the data correctly. For instance, the date will show as seconds since the Unix epoch by default, so you may need to format it appropriately. -
Save your changes in the Designer.
-
Open the Perspective session in a browser and you'll see the auditLogTable automatically populates with the audit log data on startup.
For more details, see system.util.queryAuditLog.
Access the Audit Log Using the Database Query Browser
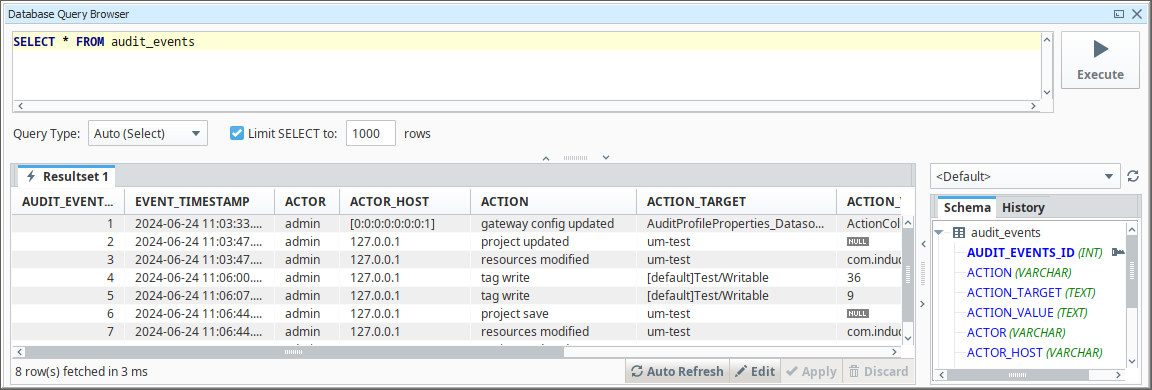
The Database Query Browser allows you to search your database tables to view audit information.
-
In the Designer, go to the Tools menu and select Database Query Browser. The Database Query Browser window will open.
-
On the right side under Schema, double-click the audit_events table, then click Execute. The data from the audit_events table will appear in the Resultset tab.
For more details, see Database Query Browser.
Access the Audit Log on the Gateway
Ignition provides a simple interface to view Audit Logs directly on the Gateway:
-
On the Gateway webpage, navigate to the Config section and scroll down to Security > Auditing.
-
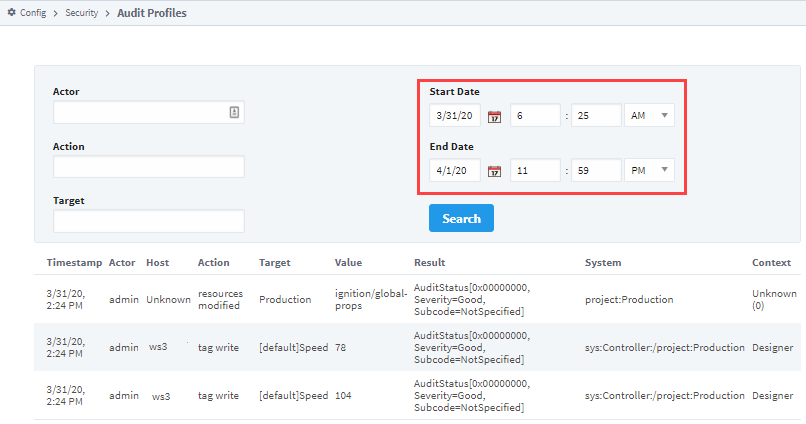
The Audit Profile page will display. Select the Audit Profile where your information is stored and click More > view log.

-
Enter specific parameter text if you're looking for something particular, otherwise, enter a Start Date and End Date, then click Search.