Using the Row Selector
The Row Selector component allows users to filter a dataset based on unique values of one or more columns. Each level in the sorting tree is based on these properties. The user will see a dynamically generated expandable tree that groups their data by any number of choices. As a user clicks down the tree, objects bound to the dataset will indicate the filtered data.

A common way to filter the data is by time. For example, you can feed the Row Selector an input dataset that represents a large time range, and have it break it up by Year, Month, and Day. Then you can power a report with the output dataset that lets the user dynamically create reports for any time range. When configuring the Row Selector for the first time, you'll notice some default Date filters in the Row Selector Tree Customizer to help you quickly configure and filter raw data by time. If you don't want to filter your data by time, then simply delete the default filters and create your own.
See the Appendix for more information on the Row Selector.
Example
A Row Selector has two important properties: Data In and Data Out. The Row Selector component filters the data in the Data In property and pushes the filtered result to the Data Out property. Let's configure a Row Selector to filter on some raw data. (This example uses a Power Table component which gives you the option of using some sample test data, or you can create your own data).
-
Drag a Power Table component on to your window and change the Name of the Power Table to "Data In Table".
-
Scroll down the Property Editor and set the TestData property to 'true'. This will populate the Data property with some test data. Alternatively, you could manually populate the Data property using either the Dataset Viewer or by creating a binding on the property.
-
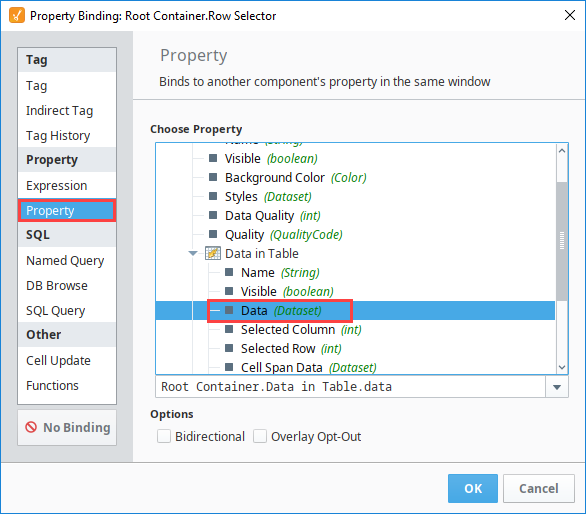
Drag a Row Selector component on to your window. With the Row Selector selected, click the Binding icon
 on the Row Selector's Data In property.
 -
Select the Property Binding Type, and bind it to the Data property in the Data In Table, and click OK.
-
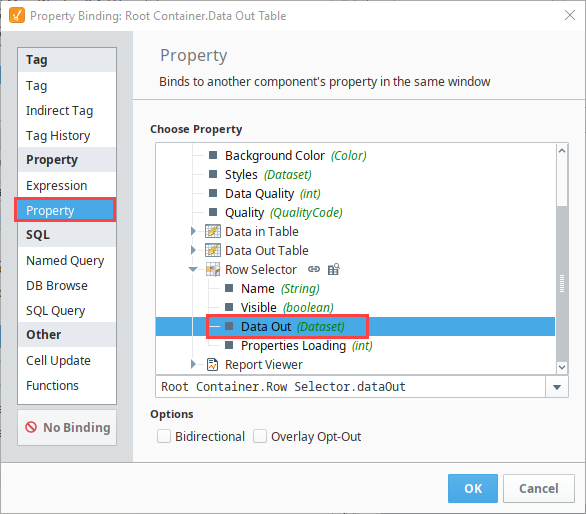
Drag another Power Table component on to your window, change the Name to "Data Out Table".
-
With the Data Table Out still selected, bind the Data property to the Row Selector's Data Out property and click OK.
 note
noteDon't worry about the 'Unknown' nodes in the Row Selector component. The Row Selector has three default Date filters which haven't been configured for your data yet. You will need to reconfigure them, or delete them and configure your own unique set of filters. Once configured, the 'Unknown' nodes will disappear.

-
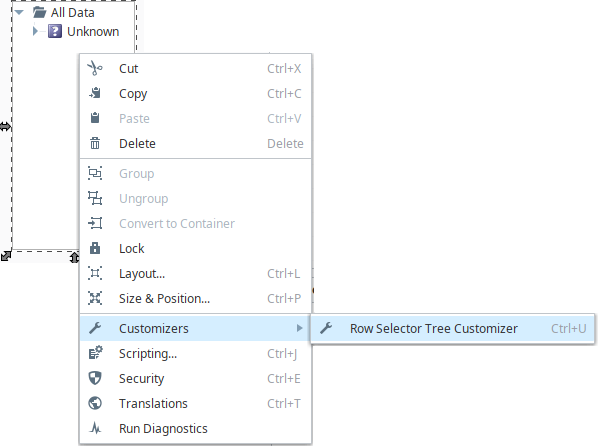
Now let's configure your filters. Right click the Row Selector component and scroll down to Customizers > Row Selector Tree Customizer.
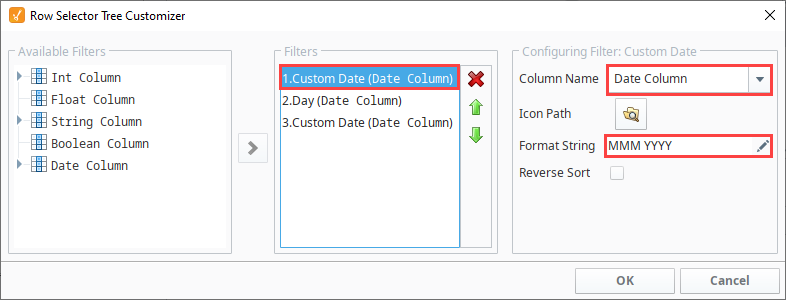
The Row Selector Tree Customizer provides three default Date filters. Here you can customize the parameters of each Date filter or choose another filter type that is more appropriate for your dataset. Each column on the Data In Table will be listed in the Available Filters tree, and the types of filters available to each column depends on the datatype of the column.
-
To start customizing, select the first filter, then change the Column Name to Data Column. (This example uses the Date column to filter on the Month, Day, and Time combination.)
-
Change the Format String to MMMM yyyy.
-
Click OK.
-
Put your Designer into Preview Mode.
-
Select Month, Day, or Time to filter on. The filtered results are displayed in the Data Out Table. In this example, we filtered on June 20th, so the Data Out Table only contains records that match that date.
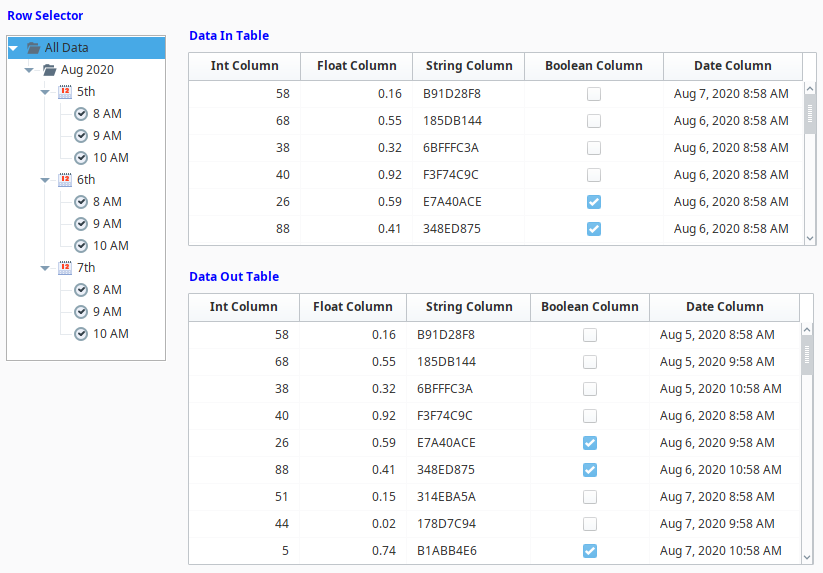
When designing your report window, it's not necessary to display the Data In Table only the Data Out Table. You also don't need a component to house the data: the Data In property on the Row Selector could simply retrieve the raw data with a binding.
Here are a few more Row Selector examples:
- A Line Graph bound to a Row Selector - Set up grouping to be first by month and year, then day, then hour, like the example above. Clicking on a month and year will dynamically update the graph for that time period. Further clicking to a specific day or hour will re-filter the graph for that period.
- A Report Viewer bound to a Row Selector - Grouping by department (String) would allow selection by department, automatically regenerating the Report on selection.
- An "Alarm History" Table bound to a Row Selector - This could first be broken down severity level (Integer), then broken into "Alarm Acknowledged" / "Not Acknowledged" (Boolean based). Clicking "Severity 3" would filter the table to all Severity 3 alarms. Selecting "Unacknowledged" would then filter the table to Unacknowledged alarms of Severity 3.