Vision - Row Selector

Component Palette Icon:
![]()
Description
The row selector is a component that acts like a visual filter for datasets. It takes one dataset, chops it up into various ranges based on its configuration, and lets the user choose the splices. Then it creates a virtual dataset that only contains the rows that match the selected splices.
The most common way to splice the data is time. You could feed the row selector an input dataset that represents a large time range, and have it break it up by Month, Day, and then Shift, for example. Then you could power a report with the output dataset, and that would let the user dynamically create reports for any time range via an intuitive interface.
To configure the row selector, first set up the appropriate bindings for its input dataset. Then use its Customizer to alter the levels that it uses to break up the data. In the customizer, add various filters that act upon columns in the input dataset, sorting them by various criteria. For example, you could choose a date column, and have it break that up by quarter. Then below that, you could have it use a discrete filter on a product code. This would let the user choose quarterly results for each product. Each level of filter you create in the customizer becomes a level in the selection hierarchy. Note that the output data is completely unchanged other than the fact that rows that don't match the current user selection aren't present.
This component is very handy for driving the Report Viewer, Table, and Classic Chart components, among others.
Properties
| Property | Description | Property Type | Scripting | Category |
|---|---|---|---|---|
| All Data Node Text | Text for the All Data node, if it is displayed. | String | .allDataNodeText | Appearance |
| Background Color | The background color of the component. Can be chosen from color wheel, chosen from color palette, or entered as RGB or HSL value. See Color Selector. | Color | .background | Appearance |
| Border | The border surrounding this component. Options are No border, Etched (Lowered), Etched (Raised), Bevel (Lowered), Bevel (Raised), Bevel (Double), and Field Border. Note: The border is unaffected by rotation. Changed in 8.1.21 As of 8.1.21, the "Button Border" and "Other Border" options are removed. | Border | .border | Common |
| Cursor | The mouse cursor to use when hovering over this component. Options are: Default, Crosshair, Text, Wait, Hand, Move, SW Resize, or SE Resize. | Cursor | .cursor | Common |
| Data In | The input of the row selection tree. The filter tree changes based on this Dataset. | Dataset | .dataIn | Data |
| Data Out | The output of the row selection tree. Changes based on user selection in the filter tree. | Dataset | .dataOut | Data |
| Expand All Data Node | If true, the 'All Data' (root) node will be expanded and selected when the user opens this window. | boolean | .expandAllDataNode | Behavior |
| Font | Font of text on this component. | Font | .font | Appearance |
| Foreground Color | The foreground color of the component. See Color Selector. | Color | .foreground | Appearance |
| Mouseover Text | The text that is displayed in the tooltip which pops up on mouseover of this component. | String | .tooltiptext | Common |
| Name | The name of this component. | String | .name | Common |
| Opaque | If false, backgrounds are not drawn. If true, backgrounds are drawn. | boolean | .opaque | Common |
| Selection Background | The background color of the selected node. See Color Selector. | Color | .selectionBackground | Appearance |
| Show All Data Node | Should the All Data (root) node be shown or hidden? | boolean | .showAllDataNode | Behavior |
| Show Node Size | If true, the number of rows in each node will be shown. | boolean | .showNodeSize | Behavior |
| Show Root Handles | Should root-level nodes have collapse handles? | boolean | .showRootHandles | Behavior |
| Unknown Node Icon | Icon for any Unknown nodes (nodes where the data didn't match the filter). | String | .unknownIconPath | Appearance |
| Unknown Node Text | Text for any Unknown nodes (nodes where the data didn't match the filter). | String | .unknownNodeText | Appearance |
| Visible | If disabled, the component will be hidden. | Boolean | .visible | Common |
Scripting
Scripting Functions
This component does not have scripting functions associated with it.
Extension Functions
This component does not have extension functions associated with it.
Event Handlers
Event handlers allow you to run a script based off specific triggers. See the full list of available event handlers on the Component Events page.
Customizers
The Row Selector has its own Row Selector Tree Customizer and allows users to customize the row filtering. The customizer provides some default filters which you can use, or customize based on the dataset.
The Row Selector Tree Customizer allows you to build and configure a tree of the data in the input dataset which can then be used to filter it. There are three main parts to the customizer. The left panel contains a list of available filters, the center panel contains a list of filters that will be used, and the right panel will contain configurable properties for the filter currently selected in the center panel.
In the Available Filters section on the left, a list of all of the columns of the dataset are shown. These can be expanded to show the filters available for that column type. Some columns might not have any filters, while others can have many, it just depends on the data type of column. These filters can then be dragged into the center panel, or highlighted and the Right Arrow ![]() icon pressed to push the filter into the center panel where it becomes an active filter.
icon pressed to push the filter into the center panel where it becomes an active filter.
The Filters panel in the center contains a list of filters that are being used with each filter being followed by the name of the column that it originated from, and is where you can decide on the order of the filters. The order is important because it is the order in which they will be used in the component. Using the image below as an example, The component will first show a list of years. You can select a particular year, and the output dataset will only contain rows from that year. Alternately, you can expand a year where you will then see a list of strings that are in rows with that year. Selecting one of the strings will display all rows with strings like the one that you selected, that are also in the same year.
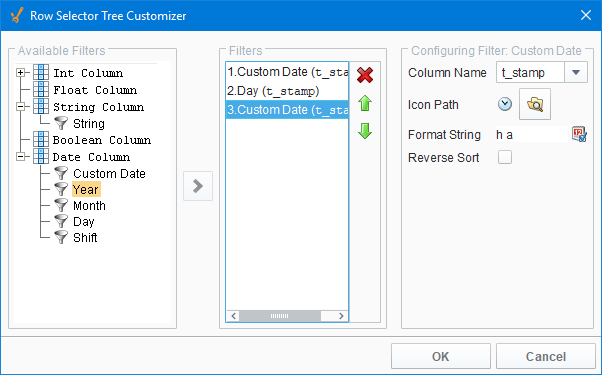
The Configure Filter panel on the right contains configurable settings that differ based on the type of filter selected. All filters at least contain an Icon Path property, which allows you to set what icon will be used with with that filter in the filter tree. Each filter type also has a reverse sort option, allowing you to have the filters displayed in reverse order in the filter tree. The unique properties are:
- Column Name
- Icon Path
- Format String (if applicable)
- Reverse Sort
Examples
There are no examples associated with this component. Refer to the examples in the Common Reporting Tasks.