Monitoring and Debugging Charts
While a chart is running, it can be monitored visually in the Designer or via a Vision Client.
In the Designer
Open the chart you wish to monitor, and any running instances of that chart will appear in the list to the right of the design space with the heading Chart Control.
Double-click on an instance to enter monitoring mode. While in monitoring mode, you'll view the current state of the chart elements. There is a banner at the top of the Designer which will bring you back to design mode.
In a Vision Client
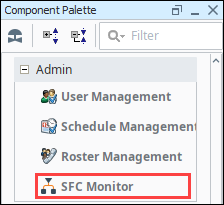
The SFC module adds a component to the Vision module under the Admin category called the SFC Monitor. Add this component to a window to be able to monitor SFC instances from your project.
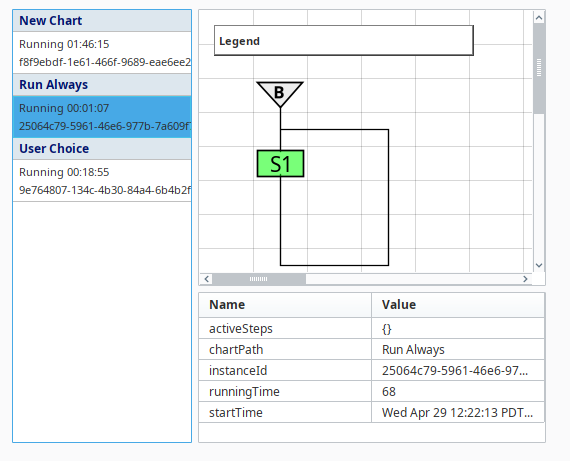
This component can either display a pick-list on its left side to pick which instance to monitor, or you can give it the ID of a specific chart to monitor and hide the pick list.
Element Legend
