SFC Designer Interface
The SFC module features a unique user interface within the Designer. To start, the Welcome tab allows you to create two types of charts: Callable and Run-Always. Each chart type is a template to help you create your system function chart. Once you enter a name for a chart type and press Create, the specified chart template will open. You will have some of the necessary elements displayed in the chart workspace to begin designing your chart. The SFC Welcome tab will also show you any recently modified charts, along with the date modified and who modified them. You can double-click on a recently modified chart and open it.
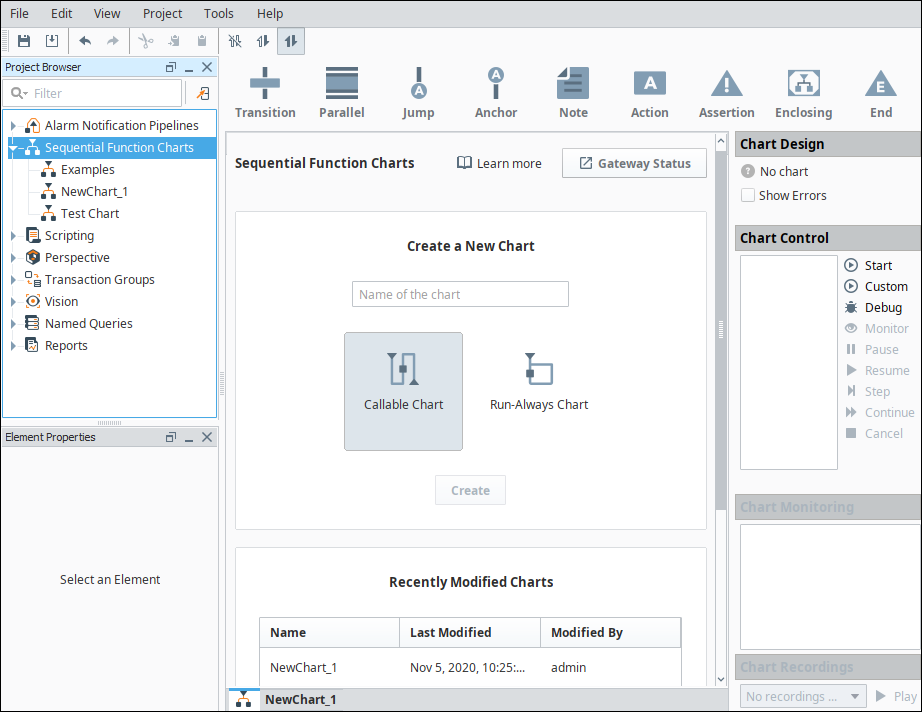
Chart Workspace
The main workspace of a chart features a grid, and is where your elements will be placed and selected.

Design View and Monitor View
Initially the SFC interface is in Design View, which means new elements can be added, repositioned, or edited. This is similar to the Design Mode in the Vision module.
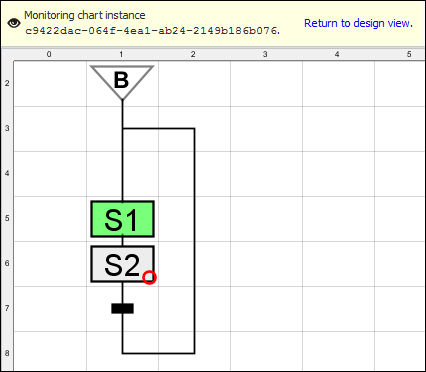
When monitoring charts, the interface switches to Monitor View, allowing the Designer to view the current state of any running charts. You may switch into Monitor View by double-clicking a chart in the Chart Control list, or by selecting a chart and clicking the Monitor icon. Use the Return to design view link to revert the workspace back to Design View and continue making changes.
Right-Click Menu
A popup menu will appear with the following options when right-clicking on an Action, Assertion, Begin, End, or Enclosing block:
- Toggle breakpoint
- Begin here
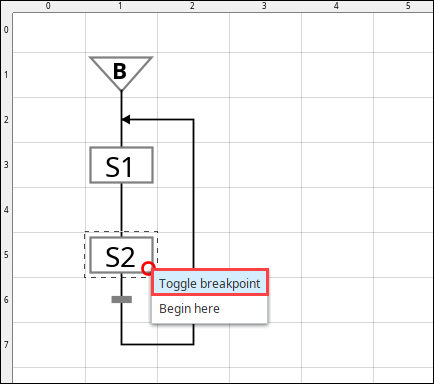
Toggle Breakpoint
Applies a breakpoint to a block, which will pause the chart when flow reaches the block in Debug Mode. Below we see the S2 element has a breakpoint applied

Begin Here
Starts a new instance of the chart at the specified element. This is similar to using the Custom icon under Chart Control, in that you can potentially set the value for any parameters.
Element Blocks
Provides a single location to drag and drop elements into the chart. The various blocks are listed on the SFC Elements page.

Element Properties
This panel provides a way to interact with selected elements. The contents of the panel change based on which element is selected. See SFC Elements for more details.

Chart Design
This section of the interface provides helpful diagnostic information. The section will state if a chart is valid.
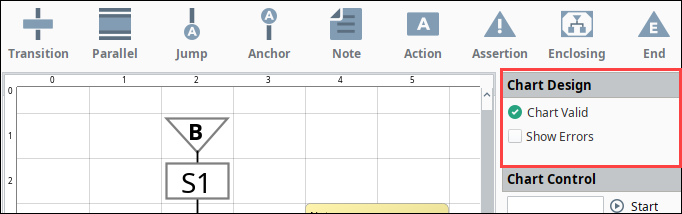
In the following example, the link after S1 is broken. You'll notice a Chart Invalid ![]() icon appears. And if you click the Show Errors checkbox, the error is annotated with a red triangle in the chart.
icon appears. And if you click the Show Errors checkbox, the error is annotated with a red triangle in the chart.

Chart Control
The Chart Control section allows you to Start or Stop charts, as well as view any running charts.
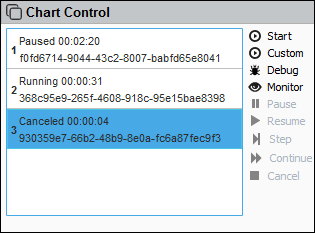
Chart Control has the added feature of displaying information about any running charts, including the current state, duration, and instance id. Double-clicking on a chart in the list will cause the interface to monitor the chart, similar to clicking on the Monitor option.
| Function | Description |
|---|---|
| Start | Start the chart that is currently viewable in the main workspace (selected tab at the bottom of the workspace). |
| Custom | Starts the current chart, but allows you to manually pass values into any chart parameters. |
| Debug | Starts the current chart, but stops at the first breakpoint. Allowing you to examine properties on the chart. |
| Monitor | Switches from Design View to Monitor View, allowing you to monitor a running chart. |
| Pause | Pauses a running chart, allowing you to later resume the chart. |
| Resume | Resumes a previously paused chart. |
| Step | While halted at a breakpoint, moves the chart towards the next step. This icon is only available in Debug Mode. |
| Continue | Continues and breaks at the next defined breakpoint. This icon is only available in Debug Mode. |
| Cancel | Cancels the selected chart. |
Chart Monitoring
Displays any properties associated with the running chart. This section is inactive in Design View, but becomes active while in Monitor View.

Chart Recording
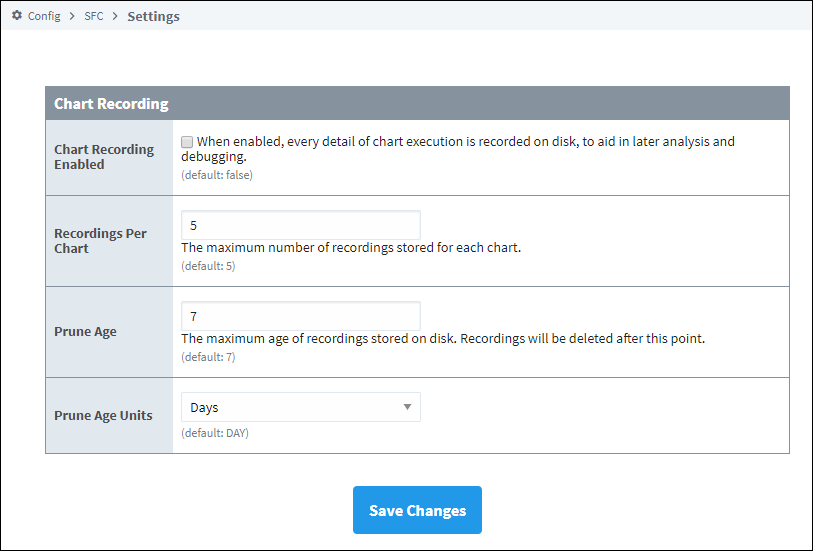
This section populates with past chart executions, and allows you to replay them from the Monitor View. Only recordings that have finished running may be examined. By default, chart recordings are disabled. You can enable recordings in the Gateway Config section under Sequential Function Charts > Settings.
Chart Recording Settings
| Setting | Description |
|---|---|
| Chart Recording Enabled | When enabled, every detail of chart execution is recorded on disk, to aid in later analysis and debugging. Default is false. |
| Recordings Per Chart | The maximum number of recordings stored for each chart. Default is 5. |
| Prune Age | The maximum age of recordings stored on disk. Recordings will be deleted after this point. |
| Prune Age Units | Unit of time for the prune age. Options are Milliseconds, Seconds, Minutes, Hours, Days, Weeks, Months, and Years. Default is Day. |