Report Component - Radar Chart
💡Have feedback for this page? Let us know on the IA Forum.
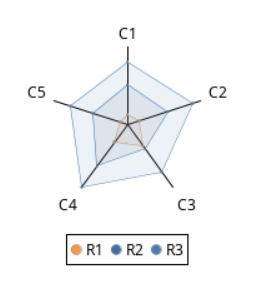
A Radar Chart allows you to quickly see values in comparison to related items or groups. Each value is plotted on a separate axis with a line drawn between the different values. This creates a shape that changes as the values change. An important property for the Radar Chart is Extract Order, which dictates whether to use an specified Variable or Series Key.
Report Design Component Palette Icon:
![]()
Properties
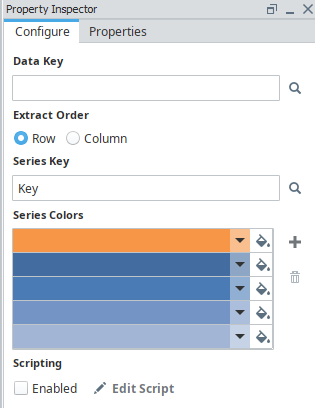
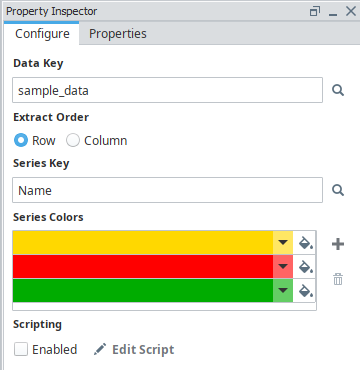
Property Inspector - Configure Tab
| Property | Description |
|---|---|
| Data Key | Unique identifier or placeholder to the data source that will populate the chart. |
| Extract Order | Specifies if the row or column should be used for the chart. |
| Series Key | Key for the series, visible only when the Extract Order is set to Row. |
| Variable Key | Key for the variables, visible only when the Extract Order is set to Column. |
| Series/Variable Colors | Adds a color to the chart for the corresponding data category. |
| Scripting Enabled | Enables the script for this component to run. |
| Edit Script | Allows the chart to be modified before the report is rendered. |
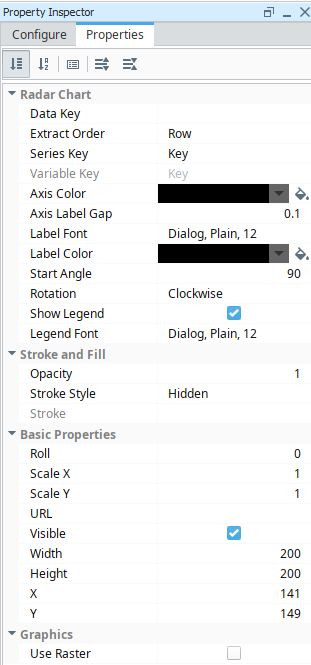
Property Inspector - Properties Tab
| Property | Description |
|---|---|
| Data Key | Data key of the dataset that drives the Radar Chart. |
| Extract Order | Specifies if the row or column should be used for the chart. |
| Series Key | Key for the series, relevant only when the Extract Order is set to Row. |
| Variable Key | Key for the variables, relevant only when the Extract Order is set to Column. |
| Axis Color | Color for the axis lines. |
| Axis Label Gap | Gap between axis and labels. |
| Label Font | Font used for this chart's labels. |
| Label Color | Color for the labels. |
| Start Angle | Start angle of the Radar Chart in degrees. |
| Rotation | Rotation direction of the spokes of the radar chart, clockwise or counter clockwise. |
| Show Legend | If true, show the chart's legend. |
| Legend Font | Font used for this chart's legend. |
| Opacity | How opaque the fill color is, between 0 and 1. |
| Stroke Style | What style of stroke or border to use: Hidden, Shape Outline, Border, or Double. To learn more about stroke styles, refer to Stroke and Fill Properties. |
| Stroke | Details for the chosen stroke. Each Stroke has its own properties depending on the Stroke Style chosen. |
| Roll | Number of degrees this shape is rotated clockwise. |
| Scale X | Amount to scale the width of this shape. 1 is scale to 100%. |
| Scale Y | Amount to scale the height of this shape. 1 is scale to 100%. |
| URL | A link to attach to this reporting component. Will be a clickable hyperlink if the report is exported as a PDF. You can use the values below to link to internal pages.
|
| Visible | If true, the shape will be visible. |
| Width | Width of this shape in pixels. |
| Height | Height of this shape in pixels. |
| X | Horizontal distance in pixels between the left edge of this shape and the left edge of the page. |
| Y | Vertical distance in pixels between the top edge of this shape and the top edge of the page. |
| Use Raster | If true, the component is displayed as a raster image. If false, the component is displayed as a vector. |
Example
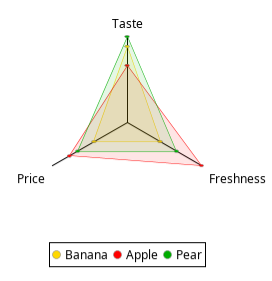
Radar Chart Sample CSV Data
Name, Taste, Freshness, Price
Banana,	8,	4,	4
Apple,	6,	9,	7
Pear,	9,	6,	6
| Property | Value |
|---|---|
| Extract Order | Row |
| Series Key | Name |
| Series Colors | #FFD800, #FF0000, #00AC00 |