Perspective - Sparkline

Component Palette Icon:

Description
The Sparkline chart is a minimalistic chart component that displays a line-chart history for a single datapoint. Sparklines were invented by Edward Tufte as a way to show a great deal of contextual information in a very small amount of space. Sparklines are typically used to display the recent history (up to current time) of a datapoint so that the viewer can quickly discern the recent trend of a datapoint: is it rising? falling? oscillating? etc..
To use a sparkline, bind its Data property either to a Historian realtime query, or to a database query. There should be two columns in this dataset: the first one a date column, the second a number. Each row will become a datapoint on the chart, and the dataset must be sorted by time in ascending order.
Instead of using axes to convey scale, the Sparkline can display a band of color across the back of the chart which indicates the desired operating range of the datapoint. In this way, it is instantly obvious when a value is in its expected range, above that range, or below. The sparkline automatically configures its internal axes based on the data given to it. To display a desired range, fill in the props.desired.high and props.desired.low properties.
Properties
Most Properties have binding options. For more information on Bindings, see Types of Bindings in Perspective. This section only documents the Props Category of properties. The other Categories are described on the Perspective Component Properties page.
| Name | Description | Property Type |
|---|---|---|
| points | Data points to plot. Accepts the following: May be a dataset, or an array of values or of objects containing X or Y coordinates. Also may be a string formatted with X and Y values separated by a comma.
| array or dataset |
| color | Color of the line. Can be chosen from color wheel, chosen from color palette, or entered as RGB or HSL value. See Color Selector. | color |
| width | Thickness of the line, in pixels. | value: numeric |
| opacity | The opacity of the line ranging from 0 to 1. 0 is fully transparent, 1 is fully opaque. | value: numeric |
| dashArray | The pattern of dashes and gaps used to paint the stroke. It's a list of comma separated lengths (in pixels) and percentages (percentage of the total stroke length) that specify the lengths of alternating dashes and gaps. If an odd number of values is provided, then the list of values is repeated to yield an even number of values. Thus, "5,3,2" is equivalent to "5,3,2,5,3,2". | array |
| range | Settings for the upper and lower edge of the chart.
| object |
| desired | The desired operating range. Settings for the desired properties operating range.
| object |
| marker | Settings for the markers on the chart. Each of the following markers have the child properties listed in the marker Type Child Properties table below.
| object |
| style | Sets a style for this component. Full menu of style options is available for text, background, margin and padding, border, shape and miscellaneous. You can also specify a style class. | object |
marker Type Child Properties
The following properties apply to the first, last, high, and low markers on the chart.
| Name | Description | Property Type |
|---|---|---|
| shape | Shape of the marker used to indicate the first point. Options are circle, triangle, or square. Default is circle. | value: string dropdown |
| size | Size of the marker, in pixels. | value: numeric |
| stroke | Settings for the stroke for the first marker. Options as follows:
| object |
| fill | Settings for the fill for the first marker. Options as follows:
| object |
| style | Sets a style for this component. Full menu of style options is available for text, background, margin and padding, border, shape and miscellaneous. You can also specify a style class. | object |
Component Scripts and Events
Further component interaction and functionality can be configured for all components through scripting and event actions. Right-click on the component or select Components from the Designer menubar to access the configuration popups for both of these options:
- Configure Events: Accesses the Event Configuration popup where you can configure actions to run in response to events to make the component dynamic. The Events Configurations page shows how to configure events and actions on a Perspective component.
- Configure Scripts: Accesses the Script Configuration popup where custom methods and message handlers can be added. The Scripting in Perspective section details scripting fundamentals, creating custom methods, and using message handlers.
Example
This example demonstrates what changes to the various marker properties can do. In addition, the desired range has been enabled.
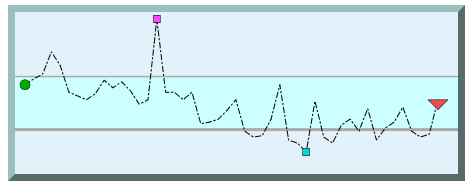
| Property | Value |
|---|---|
| props.width | 1 |
| props.dashArray | 6 2 2 2 |
| props.desired.high | 60 |
| props.desired.low | 25 |
| props.desired.stroke.color | #AAAAAA |
| props.desired.stroke.width | 3 |
| props.desired.stroke.opacity | 3 |
| props.desired.fill.color | #CCFFF |
| props.desired.fill.opacity | 4 |
| props.marker.first.shape | circle |
| props.marker.first.size | 10 |
| props.marker.first.stroke.color | #000000 |
| props.marker.first.fill.color | #00AC00 |
| props.marker.last.shape | triangle |
| props.marker.last.size | 20 |
| props.marker.last.stroke.color | #000000 |
| props.marker.last.fill.color | #EF4D4D |
| props.marker.low.shape | square |
| props.marker.low.size | 7 |
| props.marker.low.stroke.color | #000000 |
| props.marker.low.fill.color | #0D9D9 |
| props.marker.high.shape | square |
| props.marker.high.size | 7 |
| props.marker.high.stroke.color | #000000 |
| props.marker.high.fill.color | #FF47FF |
| props.style.backgroundColor | #E2F1Fa |
| props.style.borderStyle | outset |
| props.style.borderWidth | 7px |
| props.style.borderColor | #9BBFBF |